The preceding page on early space imaging systems focused on panchromatic photographs and images. However, a key takeaway from this chapter is that multispectral remote sensing enables analysts to differentiate objects that are hard to tell apart in the visible band. This page considers characteristics and applications of some of the most important multispectral sensing systems operated by government agencies as well as private commercial firms.
Government Systems
Some of the earliest space imaging platforms included multispectral sensors. One of those, which you explored a little earlier, is the Landsat program. Other U.S. government programs we'll consider briefly are AVHRR and MODIS.
Landsat MSS, TM and ETM+
Landsat satellites 1-5 (1972-1992) carried a four-band Multispectral Scanner (MMS) whose spectral sensitivity included visible green, visible red, and two near IR wavelengths. A new sensing system called Thematic Mapper (TM) was added to Landsat 4 in 1982. TM featured higher spatial resolution than MSS (30 meters in most channels) and expanded spectral sensitivity (seven bands, including visible blue, visible green, visible red, near-infrared, two mid-infrared, and thermal infrared wavelengths). An Enhanced Thematic Mapper Plus (ETM+) sensor, which included an eighth (panchromatic) band with a spatial resolution of 15 meters, was onboard Landsat 7 when it successfully launched in 1999.
Characteristics of the Landsat 5 TM and Landsat 7 ETM+ - including orbital height, spatial resolution, pass over time, spectral coverage, and data access and uses - are documented at Wikipedia's Remote Sensing Satellite and Data Overview page.
Try This!
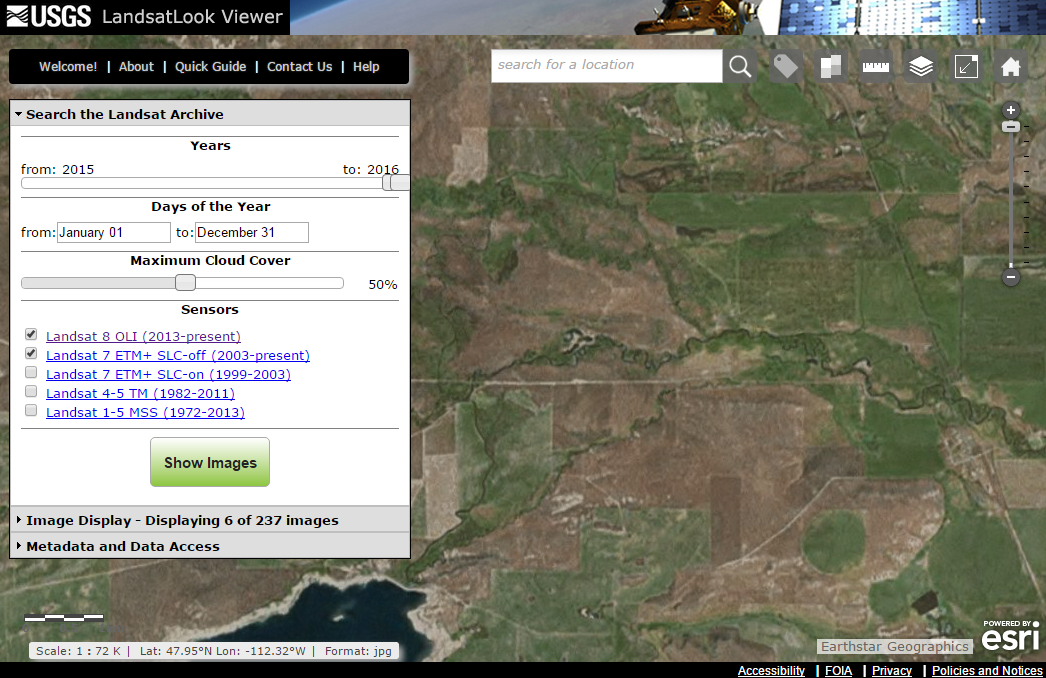
Visit the USGS' LandsatLook Viewer, which displays natural color images for all Landsat 1-8 images in the USGS archive.
Landsat 8 - OLI and TIRS
NASA's Landsat Data Continuity Mission (LDCM) launched the Landsat 8 satellite in February 2013. The satellite payload includes two sensors, the Operational Land Imager (OLI) and the Thermal Infrared Sensor (TIRS).
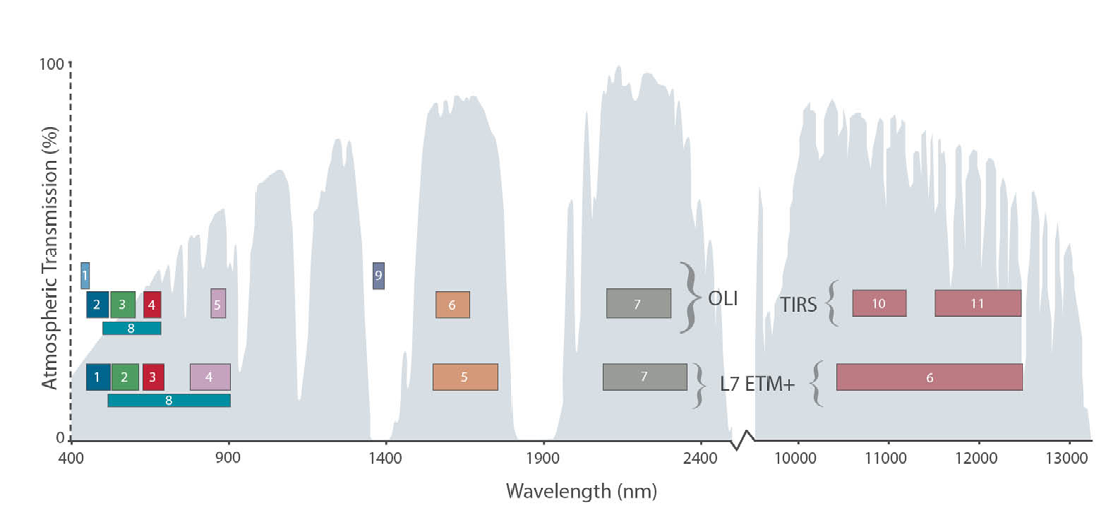
The spatial resolution of the Landsat 8 data is comparable to that of the Landsat 7 data. In regard to spectral resolution, six of the Landsat 8 bands have spectral sensitivities comparable to Landsat 7, but they have been refined somewhat. For example, the NIR band has been fine-tuned to decrease the effects of atmospheric absorption. The spectral sensitivities of Landsat 7 and 8 are compared in the figure below.
Landsat 7 is still collecting data. Landsat 8 orbits at the same altitude as Landsat 7. Both satellites complete an orbit in 99 minutes, and complete close to 14 orbits per day. This results in every point on Earth being crossed every 16 days. But, because the orbits of the two satellites are offset, it results in repeat coverage every 8 days. Approximately 1000 images per day are collected by Landsat 7 and Landsat 8 combined. That is almost double the images collected when Landsat 5 and Landsat 7 were operating concurrently.
While characteristics of Landsat 8 are documented at and is documented at Wikipedia's Remote Sensing Satellite and Data Overview page, the following table outlines scientific applications associated with each sensor band.
| Spectral Bands | Spatial Resolution | Phenomena Revealed/Use |
|---|---|---|
| 0.43 - 0.45 μm (Band 1 - visible deep-blue) |
30 m | Coastal/aerosol; increased coastal zone observations |
| 0.45 - 0.51 μm (Band 2 - visible blue) |
30 m | Bathymetric mapping; distinguishes soil from vegetation; deciduous from coniferous vegetation |
| 0.53 - 0.59 μm (Band 3 - visible green) |
30 m | Emphasizes peak vegetation, which is useful for assessing plant vigor |
| 0.64 - 0.67 μm (Band 4 - visible red) |
30 m | Emphasizes vegetation on slopes |
| 0.85 - 0.88 μm (Band 5 - near IR) |
30 m | Emphasizes vegetation boundary between land and water, and landforms |
| 1.57 - 1.65 μm (Band 6 - SWIR 1) |
30 m | Used in detecting plant drought stress and delineating burnt areas and fire-affected vegetation, and is also sensitive to the thermal radiation emitted by intense fires; can be used to detect active fires, especially during nighttime when the background interference from SWIR in reflected sunlight is absent |
| 2.11 – 2.29 μm (Band 7 - SWIR-1) |
30 m | Used in detecting drought stress, burnt and fire-affected areas, and can be used to detect active fires, especially at nighttime |
| 0.50 – 0.68 μm (Band 8 - panchromatic) |
15 m | Useful in ‘sharpening’ multispectral images |
| 1.36 – 1.38 μm (Band 9 - cirrus) |
30 m | Useful in detecting cirrus clouds |
| 10.60 - 11.19 μm (Band 10 - Thermal IR 1) |
100 m | Useful for mapping thermal differences in water currents, monitoring fires, and other night studies, and estimating soil moisture |
| 11.50 - 12.51 μm (Band 11 - Thermal IR 2) |
100 m | Same as band 10 |
AVHRR
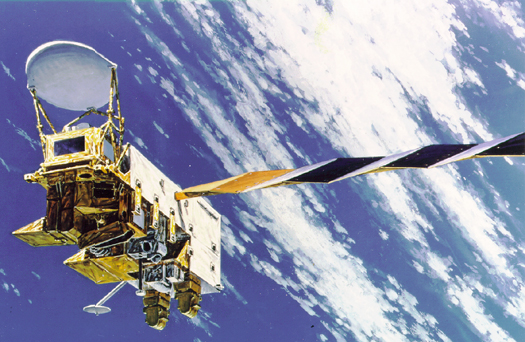
Another longstanding U.S. remote sensing program is AVHRR. The acronym stands for "Advanced Very High-Resolution Radiometer." AVHRR sensors have been onboard sixteen satellites maintained by the National Oceanic and Atmospheric Administration (NOAA) since 1979. The data the sensors produce are widely used for large-area studies of vegetation, soil moisture, snow cover, fire susceptibility, and floods, among other things.
AVHRR sensors measure electromagnetic energy within five spectral bands, including visible red, near infrared, and three thermal infrared. The visible red and near-infrared bands are particularly useful for large-area vegetation monitoring. The Normalized Difference Vegetation Index (NDVI), a widely used measure of photosynthetic activity that is calculated from reflectance values in these two bands, is discussed later.
MODIS
First launched in 1999, NASA's 36-band Moderate Resolution Imaging Spectroradiometer (MODIS) sensor has superseded AVHRR for many applications, including NDVI calculations for vegetation mapping.
Characteristics of the AVHRR and MODIS sensors are documented at Wikipedia's Remote Sensing Satellite and Data Overview page.
Commercial Systems
Christopher Lavers' 2013 article Origins of High-Resolution Civilian Satellite Imaging - Part 2 profiles several commercial systems, including SPOT, IKONOS, OrbView, and GeoEye. Characteristics of these and other contemporary sensing systems are documented at Wikipedia's Remote Sensing Satellite and Data Overview page. Not included in that page is DigitalGlobe's WorldView-3 sensor, which launched in August 2014. WorldView-3 provides panchromatic imaging at 31 cm GSD and 1.24 m multispectral. Datasheets for WorldView-3 and other DigitalGlobe sensors are available at its Satellite Information page. Coming up next in this chapter is a site visit to DigitalGlobe.
Next Generation Satellite Imaging
Also missing from the Wikipedia summary table is the new generation of micro- and nano-satellite space imaging providers like Skybox and Planet Labs. A 2014 article in IEEE Spectrum entitled "9 Earth-Imaging Startups to Watch" suggests that while "there's at most two dozen nonmilitary satellites doing Earth imaging ... Five years from now [that is, in 2020] there might be 200 or more."