Interpreting Four-Panel Progs: Taking the Next Step in Your Forecasting Apprenticeship
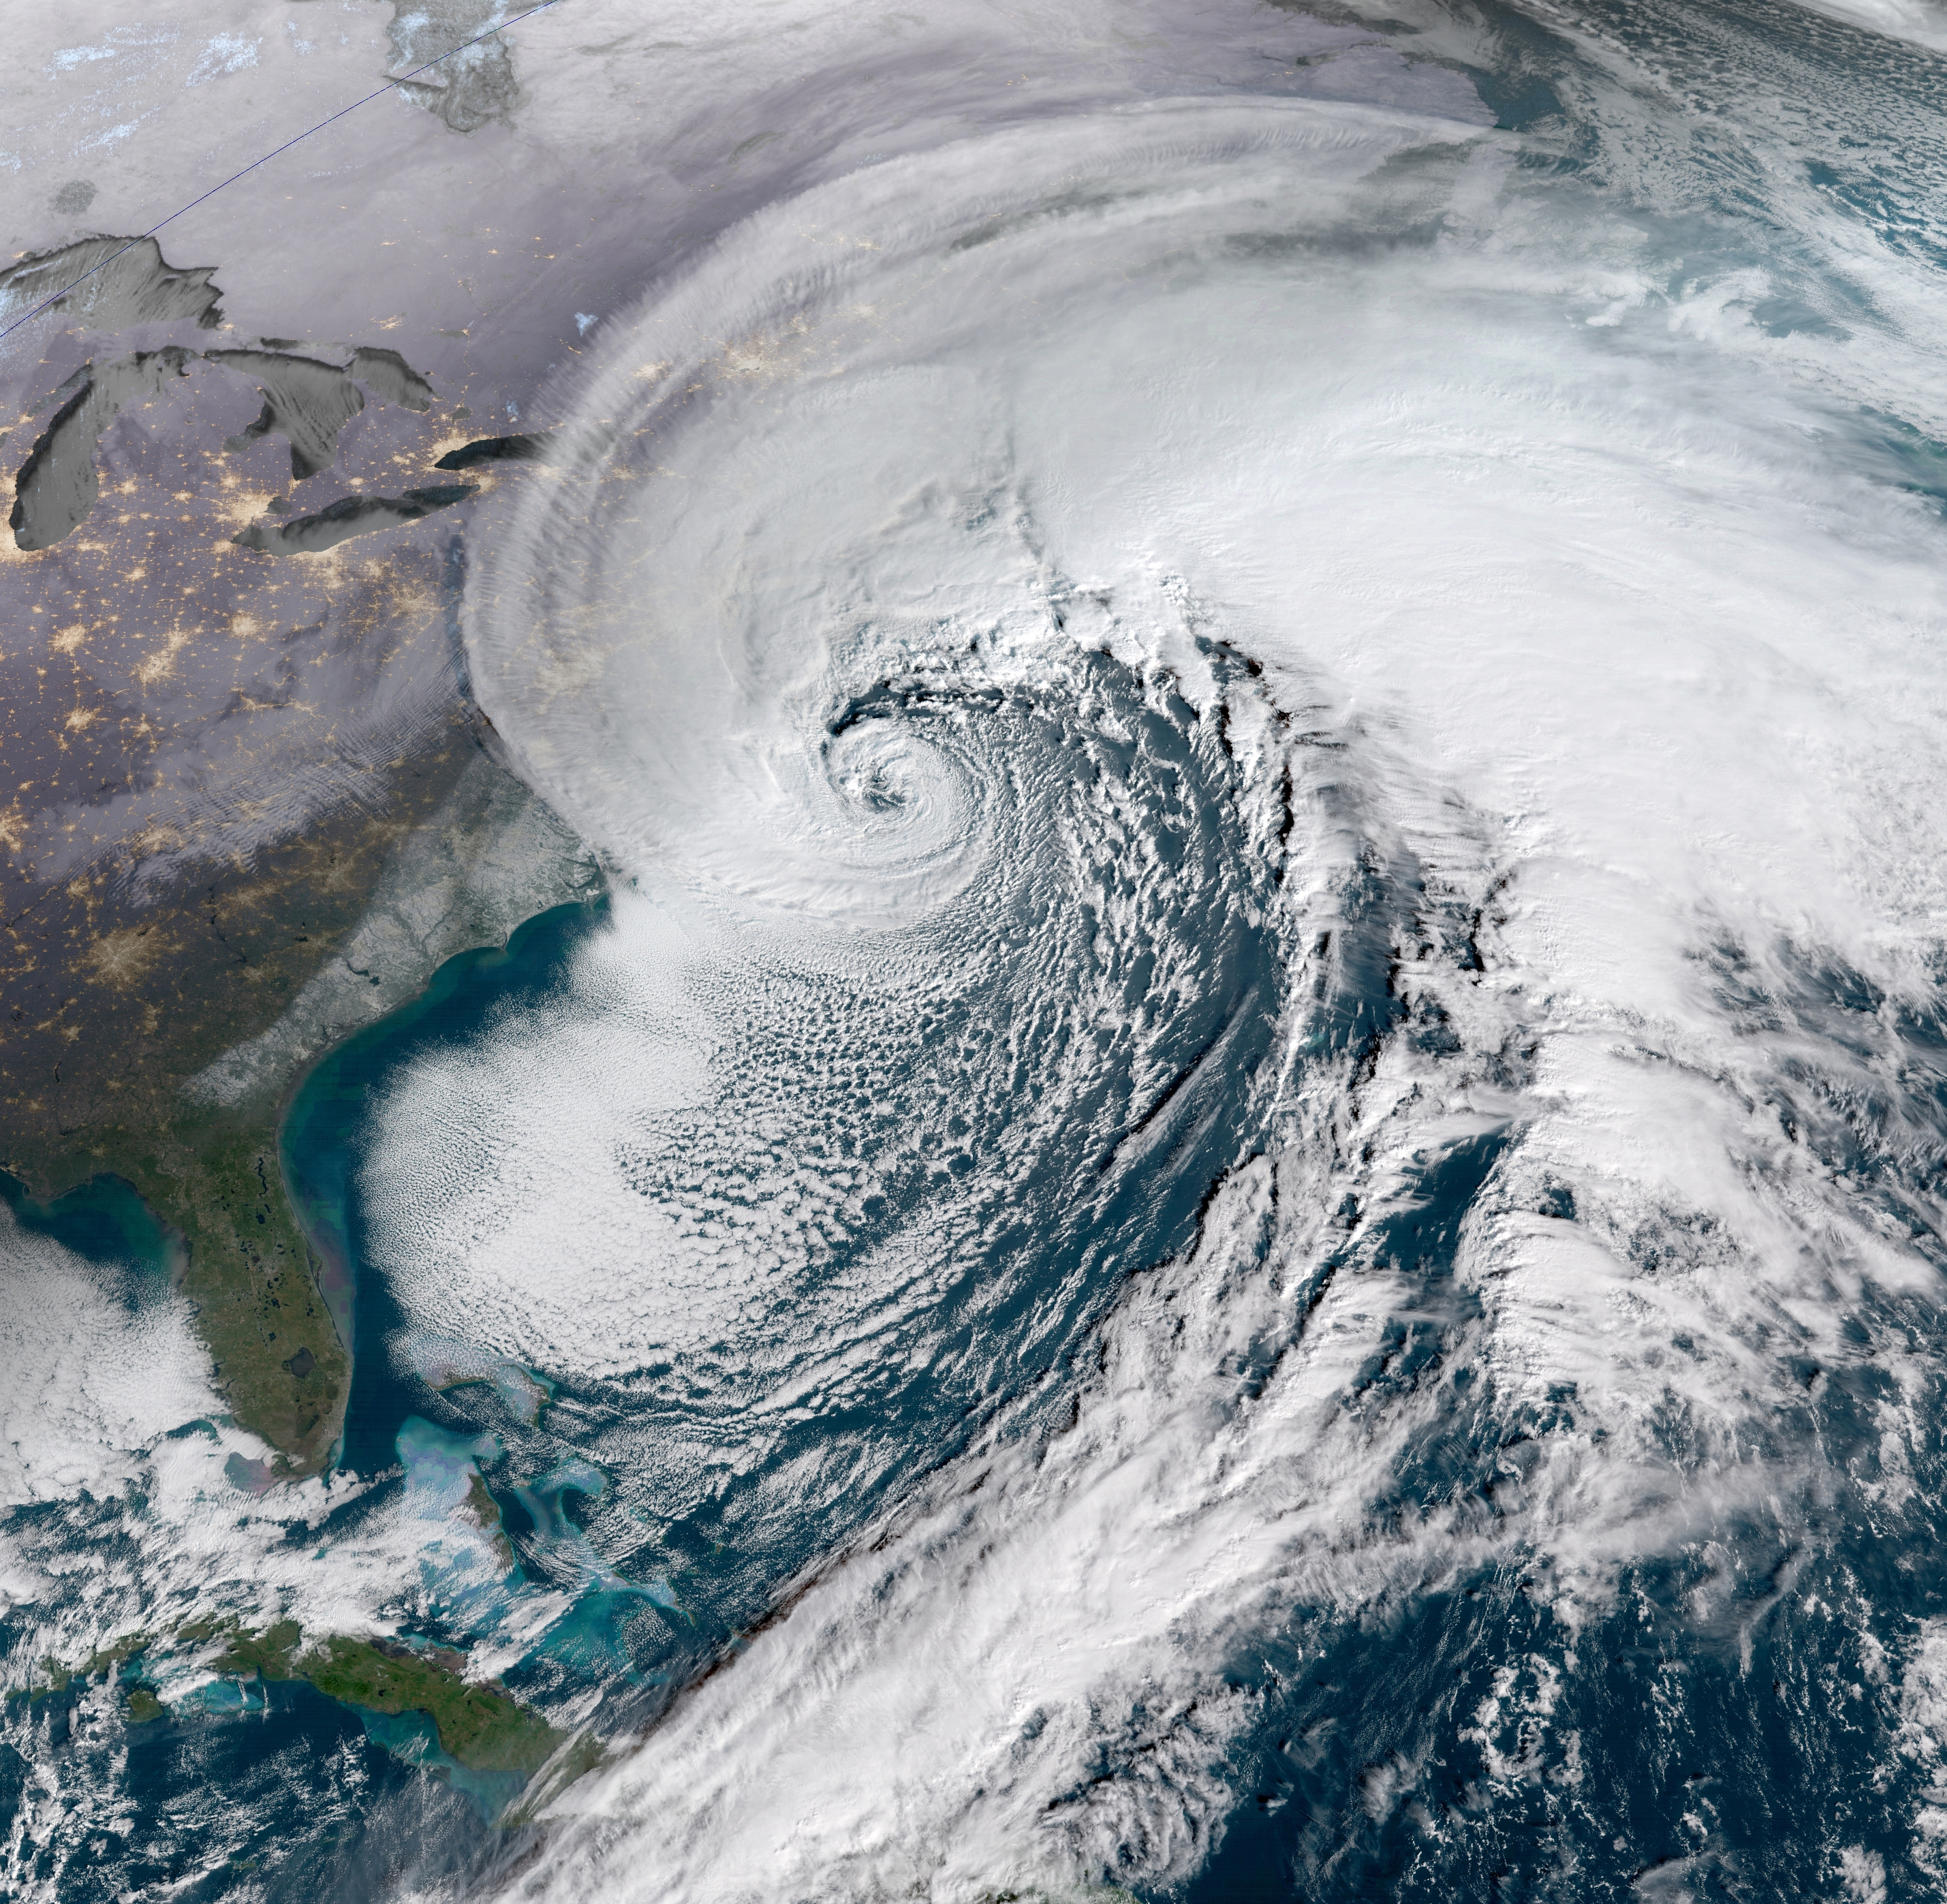
During the period, January 3-5, 2018, an historic winter storm along the East Coast produced snowfall between 10 and 20 inches (locally up to two feet) across the Middle Atlantic Seaboard and New England. Needless to say, this fierce storm caused severe disruption to the daily routine of life. As its tightly spiraling cloud pattern suggests (check out the visible satellite image below), this low-pressure system was a "bomb" (12 UTC analysis on January 4, 2018), with its central barometric pressure dropping a whopping 53 millibars in 21 hours by the morning of January 4. For the record, this negative pressure tendency was one of the largest ever observed in the Western Atlantic. How did meteorologists use numerical weather prediction (NWP) to forecast this historic storm? Read on.
To make an accurate prediction for this historic winter storm, meteorologists studied NWP output in a weather-map format. For this discussion, we will rely on a common way to present NWP data; ladies and gentlemen, we introduce the data-packed, four-panel prog (the example below was likely one of the progs some forecasters used to predict the historic winter storm of January 3-5, 2018). Yes, there are a lot of lines and colors, so please don't be intimidated. You'll be able to interpret these charts by the end of this chapter, and thereby be ready to access current numerical weather prediction maps on the Web and gain a sense for the short-term forecast at any place in the country, including your home town.
As the upper-right panel on the standard four-panel prog (below) indicates (the upper-right panel includes sea-level pressure isobars... more details in a moment), this historic East-Coast low-pressure system was predicted to be quite formidable at the time this forecast was valid. "Time" is a key word here because your first responsibility as an apprentice forecaster is to master the time codes listed below each of the four panels. After all, if you don’t know the time when the model was initialized and the forecast time when the prog is valid, you might apply the guidance to the wrong future time, causing your forecast to “bust.”
Let's get up close and personal with initialization and forecast times by zooming into the code below the upper-right panel (see image below). First of all, the "NEMS-NMMb" indicates that we've accessed the NAM (North American Model). In case you're wondering, the "NMM" stands for "Nonhydrostatic Mesoscale Model."
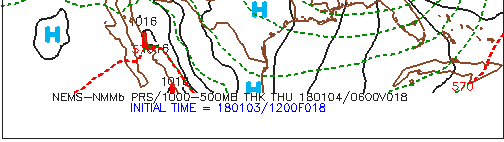
Okay, back to the business at hand. Following a fundamental rule of forecasting, you must first determine when the model was initialized so that you're sure you're looking at the most current computer guidance. Focus your attention on the bottom entry, INITIAL TIME = 180103/1200F018. The first two digits represent the year (2018), the middle two digits correspond to the month (January), and the last two digits represent the day (the 3rd). The 1200 indicates that the NAM was initialized at 12 UTC on this date (0000 would indicate 00 UTC as the initialization time). Putting it all together, this NAM run for this specific prog was initialized on January 3, 2018, at 12 UTC. Finally, F018 means that this NAM prog was the eighteen-hour forecast ("F" stands for "forecast").
It's not rocket science to deduce that this prog should be valid 18 hours after the initialization time ... at 06 UTC on January 4, 2018. The top line of time code, 180104/0600V018, verifies our simple deduction. Keeping in mind that the "V" stands for "Valid", 180104/0600V018 translates to: "This 18-hour forecast is valid at 06 UTC on January 4, 2018." So we were correct!
Although it might seem a bit tedious to you, always remember to check the time and date that a specific prog is valid before you use it to make your forecast. There's nothing more embarrassing to a forecaster than using the wrong computer guidance!
Okay, let's get down to brass tacks and learn how to interpret the four panels on a standard prog.