The image below is the 12-hour forecast for mean sea-level isobars and 1000-500 mb thickness from the WRF run initialized at 12 UTC on February 7, 2008. For reference, here's the entire four-panel prog.
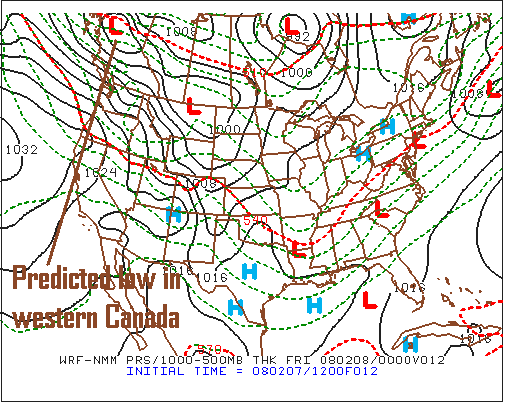
Note the low-pressure system predicted to be located in western Canada. Follow the movement and development of the low by running your cursor over the forecast times (see screen capture) associated with the loop of progs of the WRF run initialized at 12 UTC on February 7, 2008.
a. Based on the loop of WRF progs, what direction was the low predicted to move with time?
b. Keeping in mind your answer in part (a), what is the name given to this type of wintertime low-pressure system?
c. Focus your attention on the 48-hour forecast for mean sea-level isobars and 1000-500 mb thickness from the WRF run initialized at 12 UTC on February 7, 2008 (see below). For reference, here's the entire four-panel prog. Print the 48-hour forecast for mean sea-level isobars and 1000-500 mb thickness and draw the cold front associated with the low annotated on the 12-hour forecast above.
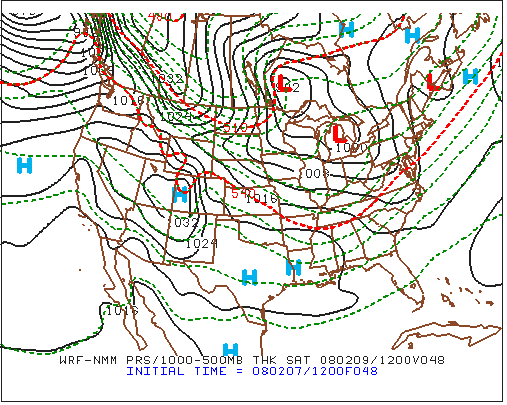
d. Explain how you positioned the cold front, based on the patterns of sea-level isobars and 1000-500 mb thickness.
e. Was this cold front an Arctic front (the leading edge of Arctic air)? Explain by pointing out a specific contour of 1000-500 mb thickess. Units are a must.
f. Now focus your attention on the WRF's 48-hour forecast for the six-hour liquid-equivalent precipitation (the lower right panel). Based on the predicted position of the 850-mb isotherm corresponding to 0oC, what type of precipitation was likely to fall? Briefly explain your answer. Does the predicted position of the critical thickness support your answer? Briefly explain.
g. Based on the color-coded key for precipitation, what range in liquid precipitation does the WRF predict will fall in the six-hour period ending at 12 UTC on February 9, 2008? Units are a must.
h. Based on your answer in part (g), give a reasonable range for snowfall during the six-hour period ending at 12 UTC on February 9, 2008 (in the region annotated on the lower-right panel). Explain your reasoning if you departed from the standard 10-to-1 ratio of solid to liquid precipitation.
i. Is such a range consistent with this type of wintertime low-pressure system? Please explain, incorporating the forward speed of the storm and its access to moisture.