Looking for an Edge in the Medium Range: Pattern Recognition
Days before the Blizzard of January 25-28, 2015, the medium-range forecast by the GFS model indicated that the possibility of a big snowstorm in the Northeast seemed like a non-starter because the predicted nor'easter would be sufficiently far out to sea. To see what we mean, focus your attention on the 108-hour forecast from the GFS initialized at 00 UTC on January 23 (the evening of January 22 in the Eastern U.S.). For the record, this forecast was valid at 12 UTC on January 27 (larger image). Note, on the upper-right panel, the intense low-pressure system off the Northeast Coast. Yes, the GFS predicted a formidable low in the medium range, but the nor'easter was far enough off the coast that hardly any precipitation was predicted to fall over New England and the Middle Atlantic States during the six-hour period ending at 12 UTC on January 27 (note the general lack of precipitation over these regions on the lower-right panel).
For sake of continuity, here are the GFS 96-hour and 114-hour forecasts, valid at 00 UTC and 18 UTC on January 27, respectively. Together with the 108-hour prog, these three GFS forecasts (96-, 108-, and 114-hour) will give you the sense that the nor'easter would all but miss New England and the Middle Atlantic States during the 18-hour period ending at 18 UTC on January 27.
Of course, nothing could have been further from the truth. Indeed, it was snowing to beat the band at 12 UTC on January 27 over eastern New England. For example, check out the meteogram at Boston's Logan International Airport below. Note that heavy snow was falling at 12 UTC on January 27, as it had hours before, and as it did hours later. Lesson learned: Beware of deterministic forecasts in the medium range that have a potential to bust big time if the track of a deep low-pressure system shifts far enough from its predicted path.
Such an important forecast for major metropolitan areas in the Northeast demanded a multi-model ensemble approach (the topic of the next section) and a cautious, deliberate tenor on Thursday night's 11-o'clock news. Something along these lines would have been appropriate: "A major storm system will develop early next week and make its way northward off the Atlantic Coast of the United States. Depending on its path, this storm could impact the Northeast or simply brush by the coast on Monday and Tuesday. We'll have more details on the implications of the various possible paths of the storm over the next couple of days."
Obviously, we shouldn't try to glean deterministic details about a winter storm from the medium-range progs. This doesn't mean, however, that we can't extract some other useful and reliable forecast information from them. Take, for example, the 96-hour GFS forecast that was valid at 00 UTC on January 27, 2015 (see the four-panel presentation above; larger image).
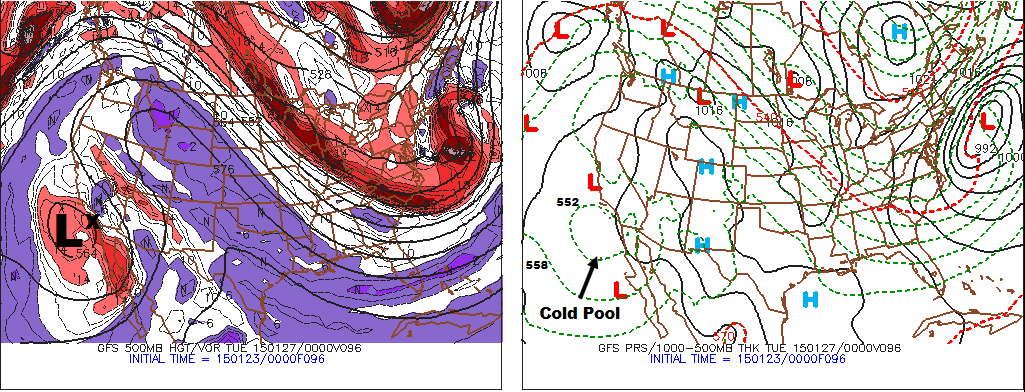
For starters, does pattern recognition come into play on this prog? Indeed it does. The upper-left panel indicates that a high-amplitude 500-mb pattern would cover much of North America on January 27, 2015, with a sprawling ridge over the West and the Plains and a full-latitude trough over the East (a full-latitude trough is old-school terminology for an upper-level trough that essentially spans from Canada to the Gulf of Mexico). Based on what you learned in Chapter 7, you could have then inferred that surface temperatures would likely be above average in the West as well as the Plains and below average in the East. Although such information is not really a determininistic forecast, it most certainly is a useful "heads-up" for weather consumers.
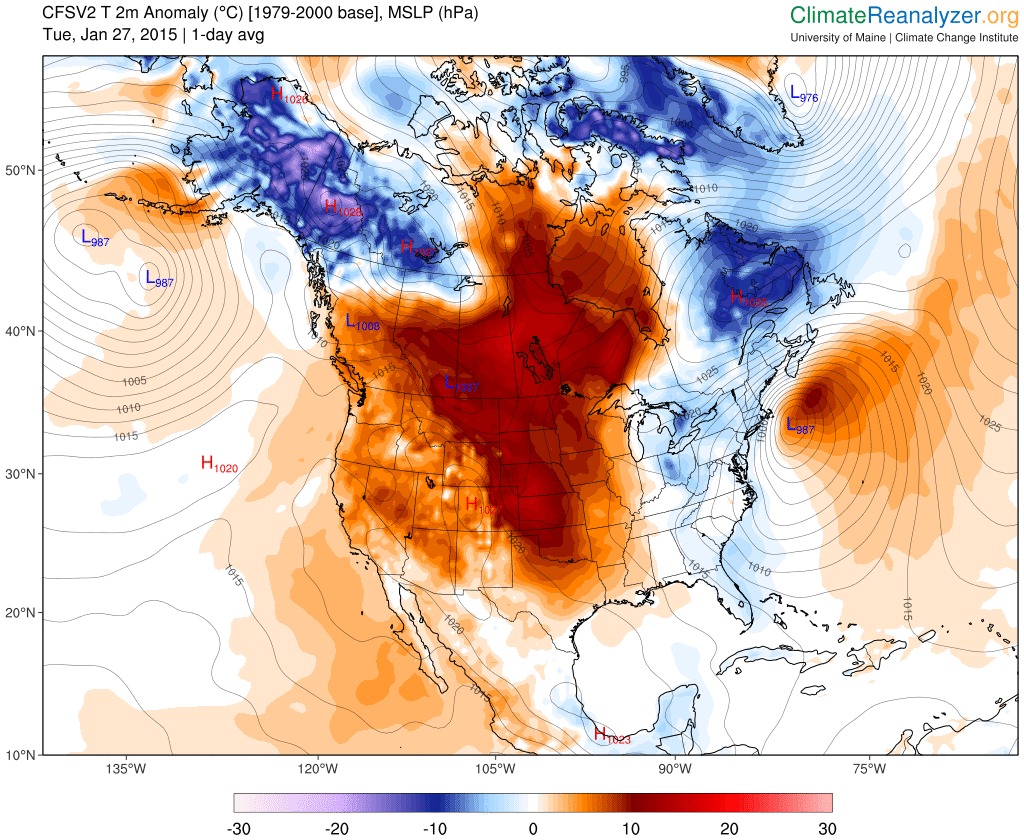
In order to validate our medium-range "heads-up," check out the chart of temperature anomalies (below; larger image) on January 27, 2015 (anomalies were calculated from daily averages and are expressed in degrees Celsius). As you can readily observe, the regions with above-average temperatures (orange and red) and below-average temperatures (blues) closely corresponded to the high-amplitude 500-mb pattern we just discussed - ridge over the West and the Plains and a trough over the East. In case you're wondering why the positive temperature anomalies were not larger over the Rockies and the Great Basin, we note that there was very dry air over the region (status quo). Dry air combined with the rather long winter night of January 26-27, set the stage for very low nighttime temperatures (expressed in degrees Celsius), which apparently offset the anomalously warmer daytime hours.
This analysis conveniently includes the daily averaged sea-level pressure isobars (labeled in millibars) on January 27, 2015. Note that the deep low-pressure system off the Northeast Coast was much closer to the coast than the medium-range GFS progs had predicted on January 22.
There were other useful forecast tidbits associated with the GFS 96-hour prog that we've been discussing. Turn your attention to the closed 500-mb low off the southern California Coast (check out the top two panels of this prog below; larger image). This closed low represented a pool of cold air aloft, whose footprint was the closed contour of 1000-500 mb thickness just off the Pacific Coast (the black arrow on the right panel pinpoints this closed thickness contour, whose value, by the way, is 5520 meters).
This closed 500-mb low was a component of the high-amplitude pattern we noted earlier, and, as such, the predicted position of the 500-mb low was fairly reliable in the medium range. That's because high-amplitude 500-mb patterns tend to evolve exceptionally slowly. In contrast, zonal flow at 500 mb (low-amplitude patterns), especially during winter, presents all sorts of medium-range challenges in the timing and forecasting of the future positions of weather systems (thus, the forecasting mantra, "Fast flow, weatherperson's woe").
Let's get back to the business at hand. Referring to the upper-left panel, please note the lobe of positive vorticity to the east and southeast of the closed 500-mb low (light and dark red shading). Within the dark-red shading, there are at least two vorticity maxima. We highlighted the most relevant vort max with a bold, black "X." The predicted position of this vort max suggested that there would be upper-level divergence and upward motion over a portion of southern California (and, in general, downstream of the entire lobe of positive vorticity). Hold this thought for a moment.
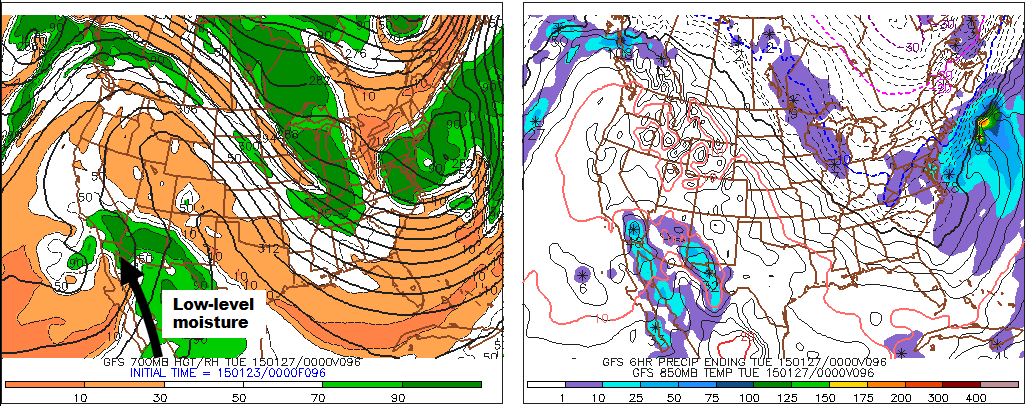
Meanwhile, the flow in the lower troposphere was from the southeast. The arrow on the left panel below (from the 96-hour GFS prog) represents a 850-mb streamline, indicating that moisture from the relatively warm Gulf of California was being transported into southern California. Note the areas with 700-mb relative humidity greater than 70% and 90%, statistically indicating clouds and precipitation, respectively, would likely be present at 00 UTC on January 27. The right panel below (from the 96-hour GFS prog) confirms this statistical relationship by predicting that there would be measurable precipitation during the six-hour period ending at 00 UTC on January 27.
The meteogram at the Los Angeles International Airport confirms these cloud and precipitation (rain) forecasts. A medium-range prediction issued on Thursday (January 23) for the possibility of rain developing late Monday (January 26) in the Los Angeles area would have been a reasonable forecast, especially if there were a probabilistic tenor to the forecast.
Let's look at one more facet of the medium-range forecast based on the GFS 96-hour prog valid at 00 UTC on January 27, 2015. Focus your attention on the lower-right panel, and note the area of generally light precipitation predicted to fall over south-central Canada and the western Great Lakes during the six-hour period ending at 00 UTC on January 27.
First, recall that the lower-right panel of the GFS prog displays predicted 850-mb isotherms. The 850-mb isotherm corresponding to 0o Celsius is the solid, black contour; 850-mb isotherms representing temperatures below 0o Celsius are dashed and 850-mb isotherms corresponding to temperatures above 0o Celsius are solid.
The area of precipitation on the lower-right panel of the 96-hour GFS prog was predicted to lie well on the cold side of the 0oC isotherm, so snow was the likely precipitation type. But before forecasting snow in the medium range, it would have helped meteorologists to get a sense for the basic meteorology explaining the predicted snow, in order to competently convey any probabilistic information in the medium-range forecast.
To establish the basic meteorology, we start with the observation that it was cold in the East and unusually warm over the West and the Plains. Therefore, it's reasonable to speculate that there was a front somewhere over the middle of the nation. With such sound logic in mind, note the low-pressure system just to the north of Minnesota (check out the upper-right panel of the 96-hour GFS prog below). No doubt that surface convergence around the low would contribute to some of the expected light snowfall, but mid-latitude lows typically have fronts, and fronts - especially warm fronts - can produce stratiform snow by way of overrunning. Let's investigate.
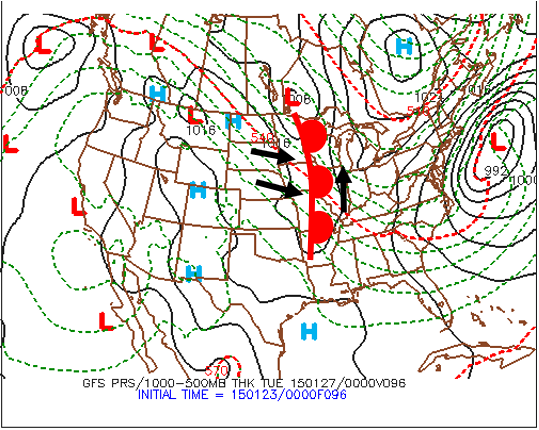
This upper-right panel of the 96-hour GFS prog predicted a trough of low pressure extending southward from a low centered over south-central Canada. The black arrows indicate a reasonable surface wind pattern in and around the trough, including the northwesterly surface winds to the west of the trough. To get a better sense for the northwesterly flow throughout the lower troposphere over the Plains, check out the lower-left panel of the 96-hour GFS prog, which clearly indicates northwesterly flow at 700 mb (northwesterly flow extended down to the ground). At any rate, these northwesterly surface winds were slated to produce warm advection (black arrows point from lower to higher thickness values). As a result, the trough of low pressure extending southward from the low over south-central Canada contained a warm front, and the generally light snow predicted by the 96-hour GFS prog would be a result of warm air overrunning colder air to the east of the warm front.
This knowledge about northwesterly winds overrunning the warm front helps to solidify a reasonable reference to the possibility of snow in the medium-range forecast during the six-hour period ending at 00 UTC on January 27, 2015.
We were a bit fortunate in this instance. We extracted fairly reliable information from medium-range progs in a high-amplitude pattern, whose evolution (in general) is rather slow and more predictable. Thus, on Thursday evening, January 22, 2015, forecasters had reasonably high confidence in predicting above-average and below-average temperatures over the West and East, respectively, as well as the possibility of rain over southern California from the closed low at 500 mb. These predictions were not a done deal, however, but the uncertainty in both forecasts was relatively small (in the case of the closed 500-mb low off the southern California Coast, forecasters were confident about the general possibility of rain, but predicting specific rainfall at specific locations would have been highly uncertain).
The forecasts for the possibility of snow over the western Great Lakes on Monday, January 27, 2015, and, of course, the deep storm off the Northeast Coast, had more uncertainty, primarily because both low-pressure systems were associated with relatively fast-moving, short-wave troughs at 500 mb. Although these short waves were embedded in the high-amplitude, long-wave pattern, they were not part of the long-wave pattern, so their speed and positions had more forecast uncertainty, especially in the medium range.
In these more uncertain situations, forecasters would have been better off had they taken a probabilistic approach and incorporated the science of ensemble forecasting. Read on.