1. You are given the upper-right panel of the four-panel prog from the run of the WRF (see image below). For reference, here's the entire four-panel prog.
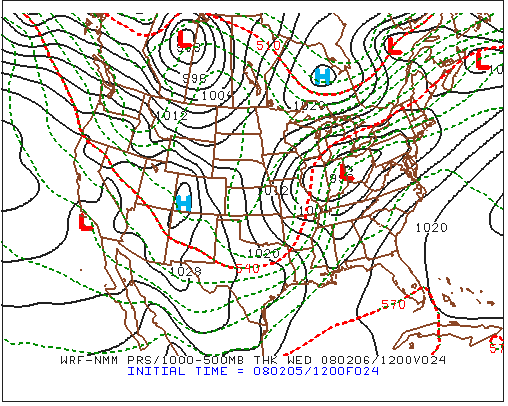
The upper-right panel of the four-panel prog from a WRF run.
Penn State and NCEP
- What was the date and time the model was initialized?
- When was the prog valid (give time and date)? Briefly explain, incorporating the number of forecast hours associated with the numerical prediction.
- Here's an annotated version of the upper-right panel. Notice Point P, which lies in the western Gulf of Mexico. Estimate the predicted surface wind direction at Point P (give your answer in degrees). Briefly explain how you arrived at your answer.
- Focus your attention on the low-pressure system predicted to be centered over the Ohio-Indiana border. Print the panel and then draw the cold and warm fronts associated with this low. Explain how you located the warm and cold fronts. Use your answer in part (c) to help you locate the cold front in the Gulf of Mexico.
- Is your placement of the cold front in the Gulf of Mexico consistent with the surface wind direction at Point P (from part (c)) and the precipitation pattern shown in the lower-right panel? Briefly explain.
- Was the low-pressure sytem a mature mid-latitude cyclone at this forecast time? If so, confirm by printing the lower-left panel and drawing the approximate axes of the low's cold- and dry-conveyor belts. Make sure you label each conveyor belt.
- What was the greatest downward motion that the WRF predicted in the immediate wake of the low or its cold front (at this forecast time)? Proper units and the sign (positive or negative) are a must! Where was the pocket of strong downward motion predicted to be at this forecast time? Did this predicted pocket of strong downward motion likely correspond to a specific feature associated with the mid-latitude cyclone? Please explain.
- In which state did the WRF predict the strongest cold air advection in the wake of the low's cold front (at this forecast time)? Explain your answer, incorporating the reason why you can use 1000-500 mb thickness contours as a proxy for isotherms.
- Estimate the predicted 1000-500 mb thickness at Buffalo, NY, at this forecast time. Units are a must!
- Notice that the WRF's lower-right panel predicted precipitation to fall at Buffalo during the six-hour period ending the time the prog was valid. Using only the upper-right panel, what was the chance (greater than 50%, less than 50%, or equal to 50%) that the precipitation would fall as snow (versus rain) at Buffalo during the six-hour period ending the time the prog was valid? Explain your answer.
- Was your answer in Part (j) consistent with the meteogram for Buffalo (see below)? To justify your answer, cite specific type(s) of precipitation that fell during the six-hour period ending at the time the prog was valid.
The meteogram at Buffalo, New York, on the day the prog was valid.
University of Wyoming and NCEP