Using the Models: All for One, and One for All
Let’s mentally conduct a simple but revealing test of human fallibility. Imagine that the first person in a fairly long line of people whispers a bit of information to the second person in line. Then the second person whispers what he or she heard to the third person, and so on. By the time the chain of whispers reaches the last person in line, the original bit of information has likely been jumbled and changed. These changes or “errors” grew as each person in line slightly altered the previous whisper as she or he passed it on.
In similar fashion, a computer model takes the initialized state of the atmosphere and then passes on its numerical forecast to the first virtual time interval (perhaps a minute or two into the future). In light of the inherent errors associated with the leap-frog scheme used by computer models (not to mention the imperfect process of initialization), it should come as no surprise that the forecast is a bit off the mark. The first time interval then passes on this error to the second time interval, which passes on a slightly different version to the third time interval, and so on. By the end of the forecast run, slight errors near the start of the simulation will have likely worsened.
Now suppose that there are two lines of people of equal length, and the first person in each line whispers an identical message to the second person. In keeping with the fallibility idea, the last two people in each line would likely hear two different messages. However, an independent interpreter, after listening to the last two people in line, might be able to blend the different messages and thereby deduce a more accurate form of the original whisper.
In a similar way, forecasters routinely compare the forecasts made by several computer models (see example below). Even though these forecasts might not be the same, an experienced meteorologist can blend the predictions of the models (a consensus forecast), with the hopes of improving the forecast.
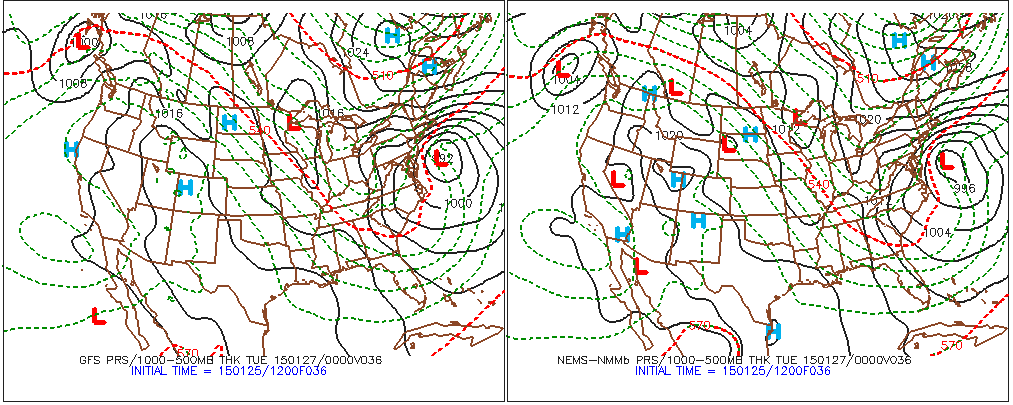
When different models (the GFS, the NAM, etc.) produce similar forecasts for a specific area at a specific forecast time (or a specified period), meteorologists typically have higher confidence issuing their forecasts because there is rather high consensus. For example, on January 25, 2015, there were only slight differences between the 12 UTC model predictions for the track and strength of a nor'easter expected to dump heavy snow on the major metropolitan areas in the Northeast on January 26-27, 2015 (revisit the comparison above).
As a result, meteorologists were fairly confident about their deterministic forecasts for total snowfall. For example, the forecast below was issued Sunday afternoon, January 25, 2015, by the National Weather Service for the New York City metropolitan and southern New England areas (the brunt of the storm was slated to occur on Monday and Tuesday). For the record, a deterministic forecast is one in which the forecaster provides only a single solution. This snowfall forecast clearly qualifies as a deterministic forecast.
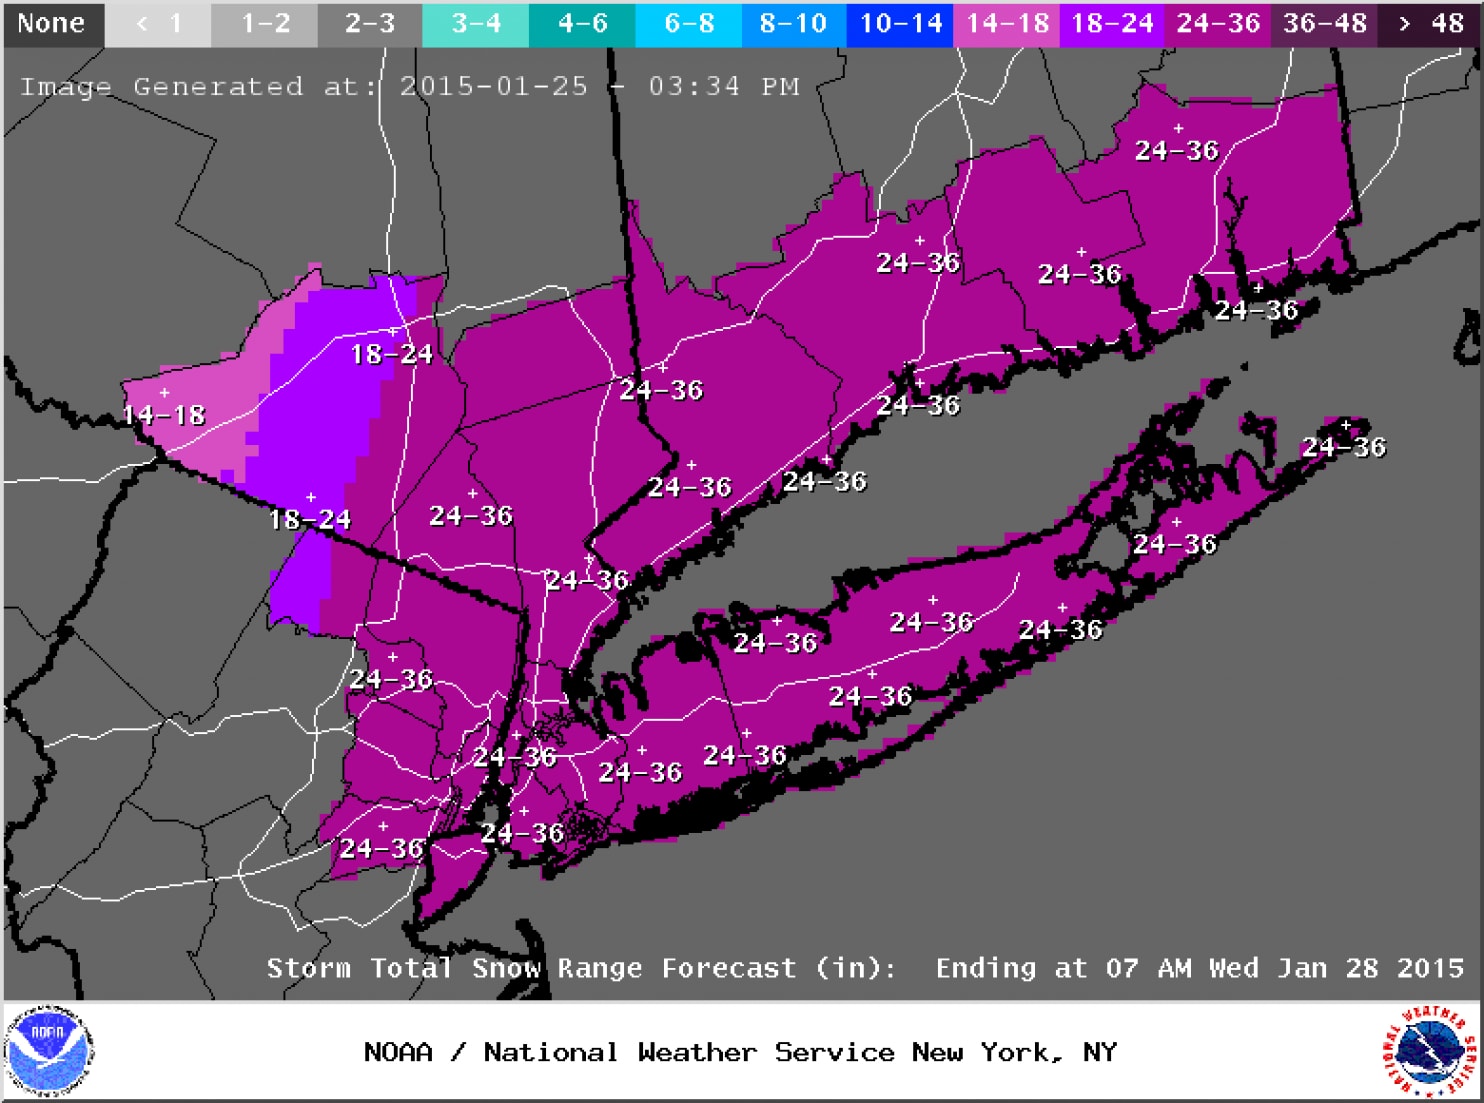
Once forecasts for historic snowfalls were issued, seven states of emergencies were declared from Pennsylvania to New Hampshire, and major highways were closed throughout the Northeast. Aviation was not spared as roughly 7,000 flights were cancelled. Businesses and schools also closed, and public transit was either shut down or severely curtailed. The subway system in New York City was shut down for the first time in its history due to an imminent snowstorm (2-3 feet of snow were predicted for the Big Apple). Needless to say, the pressure on forecasters was quite high (unlike the falling barometric pressure of the developing nor'easter).
In 20-20 hindsight, forecasters probably should have conveyed some uncertainty to the public on January 25, 2015, because a "historic snowstorm" did not materialize in some areas (see image below). For example, the National Weather Service predicted up to three feet of snow in New York City, and, yet, "only" 10 inches fell (a significant snowfall, no doubt, but hardly three feet). In Philadelphia, PA, the National Weather Service predicted 14 inches. Only two inches were measured. That's a really big deal as far as emergency planning is concerned.
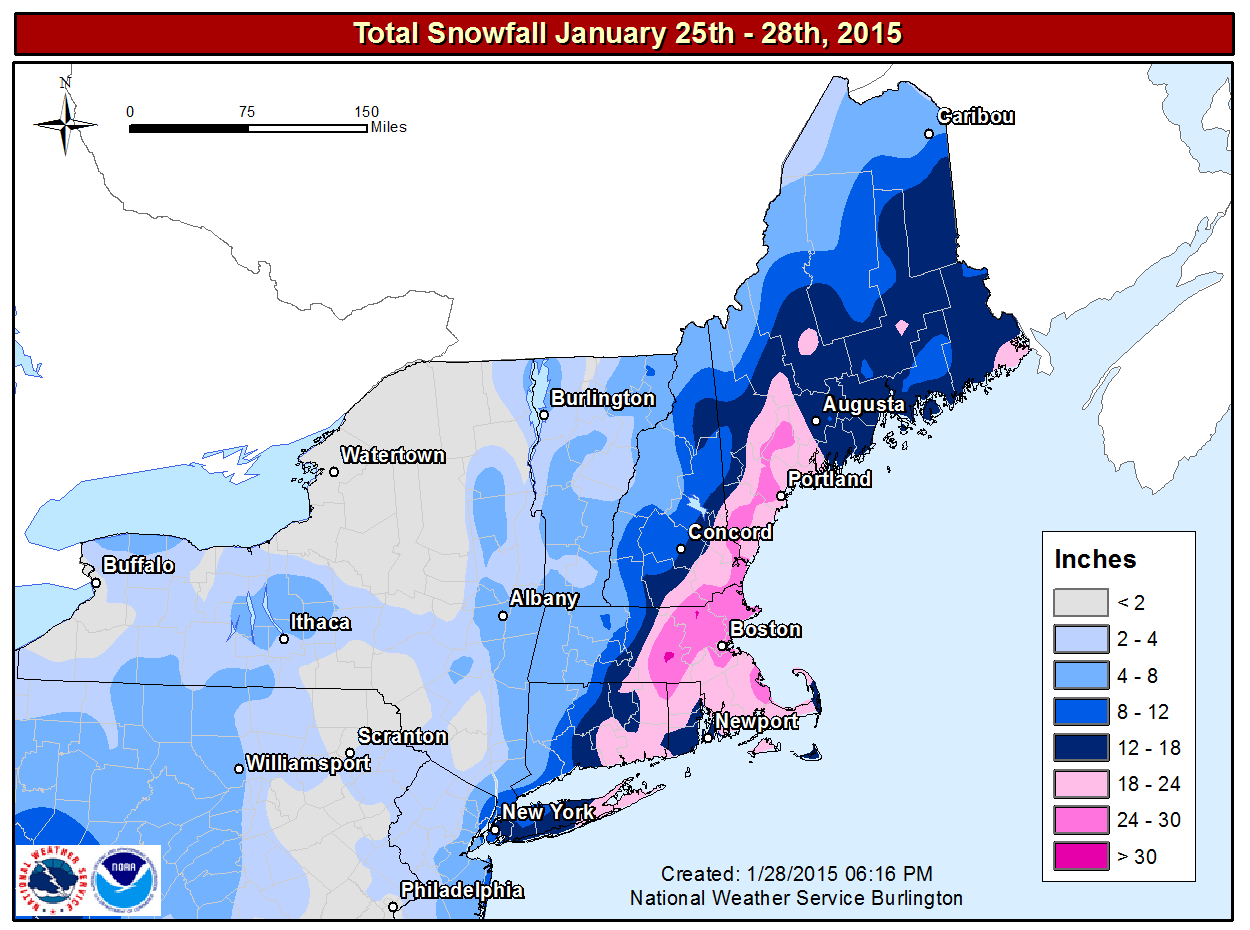
On the flip side, the National Weather Service's forecast for eastern New England had exactly the right tenor of a "historic snowstorm." For example, Worcester, Massachusetts, recorded 34.5" of snow, the city's greatest snowfall on record (records date back to 1892). So the National Weather Service was egregiously wrong in some places while they were right on target in others.
How could a great forecast at many cities and towns be so wrong in other places? The simple answer is that the eventual track of the storm was 50 to 100 miles east of where earlier runs of the models had predicted (here's the storm verification). As a result of the eastward shift in the low's path (from the models' predicted track), cities and towns farther west, which were slated to receive potentially historic totals, got much less snow than forecast. In the grand scheme of numerical weather prediction, the eastward shift from the predicted storm track might seem like a relatively small error, but it made a huge difference in snowfall at Philadelphia and New York City.
Although deterministic forecasts such as the snowfall forecast for January 25-28, 2015, are pretty much standard practice these days, the specificity of deterministic forecasts makes them vulnerable, especially when there's a rather high degree of uncertainty. A more realistic approach is used by some forecasters when they recognize that the forecast uncertainty makes it too risky to issue a deterministic forecast without adding important qualifiers. In these situations, forecasters attempt to convey the uncertainty to the general public by providing probabilities for various possible outcomes.
What specific strategies do weather forecasters have at their disposal to make forecasts when there is a meaningful degree of uncertainty? Read on.