Introduction
The debate about whether Sandy was a hurricane or hybrid system at landfall has generated much discussion, particularly as it relates to the National Hurricane Center passing the responsibility for issuing warnings to local offices of the National Weather Service. I cannot accept the notion that Sandy was purebred hurricane at landfall. Indeed, I'm convinced that Sandy was in the process of transitioning to a post-tropical low-pressure system as it approached landfall (just as NHC had anticipated). Let's investigate.
Looks Like a Duck, but...
As Sandy bore down on the New Jersey Coast late Monday afternoon (October 29, 2012), I looked at the 2047Z AMSU-A cross section (shown below) through the storm. By the way, AMSU stands for Advanced Microwave Sounding Unit (read more). This cross section displays the temperature difference (in Kelvins) between the core of the storm and the storm's environment at each pressure altitude from 1000 mb to 100 mb. Right off the bat, you might jump to the conclusion that Sandy was a purebred tropical system...warm core from the earth's surface all the way to the lower stratosphere.

As it turned out, what looked like a duck and quacked like a duck was really not a duck. In other words, we need to "read between the lines" on the AMSU-A cross section. But I'm getting a little ahead of myself on the details of this cross section, so I'll get down to brass tacks and show that Sandy was in the process of transitioning to a post-tropical storm as it bore down on the New Jersey Coast.
Transitioning to Post-Tropical
Once Sandy completed its sharp turn toward the west off the Middle Atlantic Seaboard, the hurricane started to interact with the surrounding baroclinic environment. To see what I mean, check out (below) the 00Z NAM model analysis on October 30 (8 P.M. EDT on October 29) of 700-mb heights (in meters), 700-mb wind barbs, and 700-mb temperatures (color-filled in degrees Celsius). Here's a larger image to aid in the analysis. I annotated a portion of Sandy's circulation (on the image below) where cold-air advection was taking place (yes, there was cold advection produced by southerly winds).
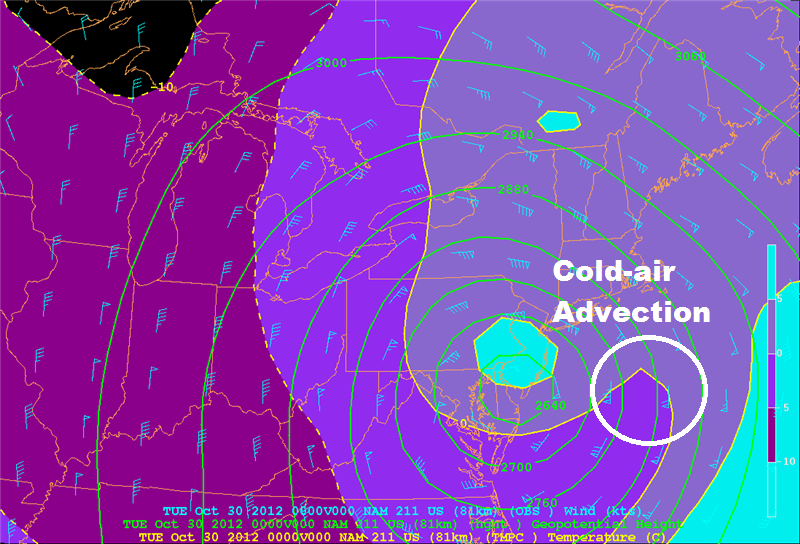
The bottom line here is that cold air had already begun to wrap into the circulation of Sandy, indicating the storm's transition to a post-tropical low-pressure system.
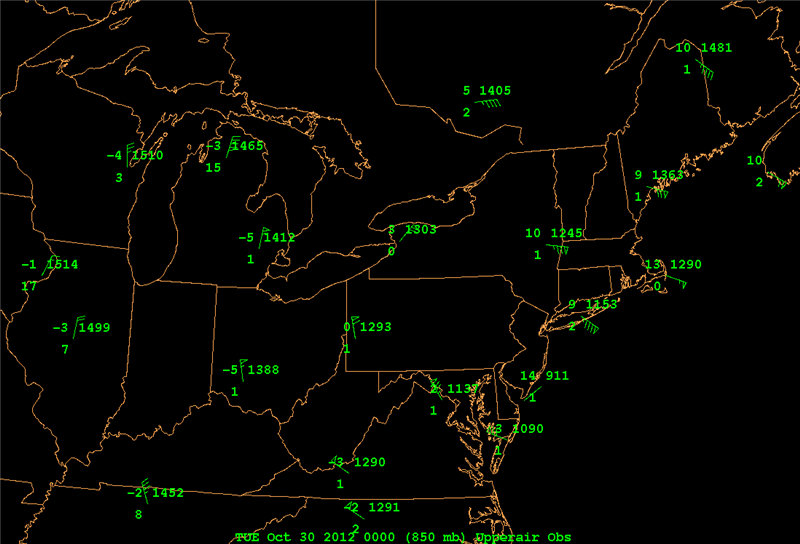
This pattern of cold advection also prevailed at 850 mb (00Z NAM model analysis of 850-mb heights, wind barbs, and temperatures). Also, please note the warm-air advection to the north of Sandy. I circled a portion of Sandy's circulation where there was warm advection on the annotated version above (yes, there was warm advection produced by northeasterly winds).
To gain another perspective on Sandy's evolving post-tropical circulation, focus your attention on the 850-mb temperatures measured by radiosondes at 00Z (station plots below). Note the rather large temperature gradient south of Sandy's center (3 degrees Celsius at Wallops Island, -3 degrees at Roanoke / Blacksburg, and 2 degrees Celsius at Washington's Dulles International Airport compared to 15 degrees Celsius near the core of Sandy just off the New Jersey Coast (Sandy's 850-mb ob is not shown on the station plots; see 2355Z aircraft reconnaissance). Moreover, 850-mb temperatures near 0 degrees Celsius so close to the center of Sandy is hardly compatible with a purely tropical system. Without reservation, Sandy was transitioning to a post-tropical low-pressure system (consistent with NHC's forecast discussion issued at 5 P.M. on October 27).
Okay, with the transition to a post-tropical storm taking place as Sandy approached New Jersey, let's tackle the misleading message sent by 2047Z AMSU-A cross section on October 29. At the time, it sure looked like Sandy was warm core (and tropical) as it bore down on the New Jersey Coast. As it turned out, I didn't read between the lines.
Tricky AMSU-A Cross Section
Having convinced myself that Sandy was not a hurricane at landfall (it was more of a hybrid during its transition to a post-tropical low), I was faced with resolving what I was apparently missing on the 2047Z AMSU-A cross section. What was I missing on the AMSU-A cross section?
In a nutshell, the vertical and horizontal resolution of the AMSU instrument is pretty coarse, with several kilometers between weighting functions in the vertical and 50 kilometers at nadir in the horizontal. With regard to the vertical resolution, any cooling in the upper troposphere associated with the approach of the negatively tilted short-wave trough "might have fallen through the cracks" on the AMSU image (as a reminder of the 500-mb short wave that played a pivotal role in Sandy's evolution, check out the 18Z NAM model analysis of 500-mb heights and absolute vorticity on October 29).
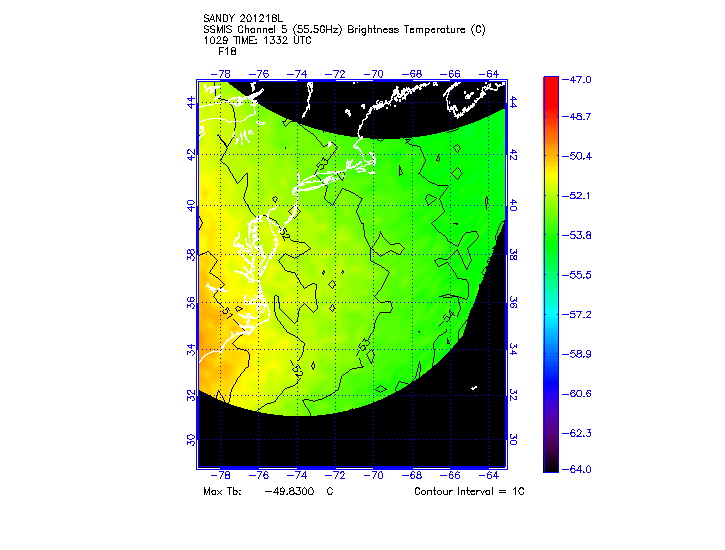
With these "cracks" in mind, I turned to the Special Sensor Microwave Imager / Sounder (read more about the SSMIS), whose weighting functions are slightly different from the AMSU instrument and whose horizontal resolution is higher. Perusing the SSMIS data at the 1333Z data on October 29, we can see the footprints of Sandy's warm core on Channel 3 (350 mb) and Channel 4 (250 mb). For geographical reference, note that the East Coast of the United States is outlined in white, so both channels contain upper tropospheric data over the eastern United States and offshore Atlantic waters.
There's a different story on Channel 5 (approximately 150 mb; see image below). Indeed, the footprint of Sandy's warm core isn't apparent at 150 mb (there aren't any closed, "warm isotherms" in the vicinity of the storm). That's probably because of wind shear (15Z analysis of deep-layer shear) associated with the approach of the short-wave trough. The point I'm trying to make here is that as early as 1333Z on October 29, the footprint of Sandy's warm core had, at the very least, weakened at 150 mb (roughly 14000 meters). In other words, the first dominos were falling, setting into motion Sandy's gradual transition from tropical to post-tropical.
Although the warm core of Sandy isn't apparent on the SSMIS Channel 5 image, it was still relatively warm air at 150 mb over the eastern United States and offshore Atlantic waters at this time. If my theory is correct (that Sandy was starting to transition to a post-tropical low), how is that possible?
Well, heights were falling as the short-wave trough approached. To see what I mean, check out the 12Z station models at 500 mb on October 29 and compare them to the 00Z station models at 500 mb on October 30. Note that 500-mb heights fell 210 meters at Wallops Island, Virginia, and 170 meters at Upton, New York during the 12-hour period (both upper-air stations are circled in white).
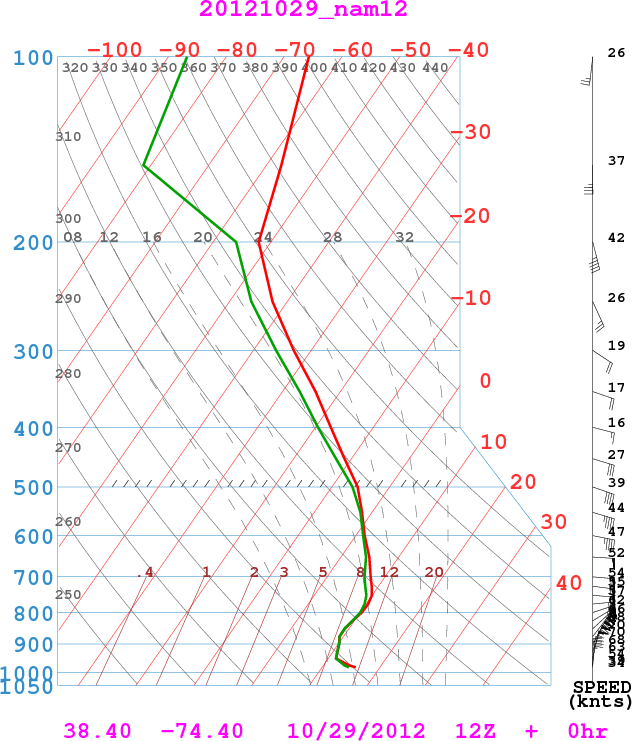
What were the ramifications of these height falls? To answer this question, check out, above, the NAM model sounding at 38.4 degrees North and 74.4 degrees West at 12Z on October 29 (the lat-long coordinates of Sandy's center at this time). Clearly, with falling heights associated with the short-wave trough,150 mb now lay in the lower stratosphere (the tropopause began around 200 mb on this NAM sounding). So the footprint of relatively warm stratospheric air was present above 200 mb mb on the AMSU-A cross section (150 mb, 100 mb, etc.), lending the false impression that Sandy was purely warm core from the sea surface to 100 mb.
I should point out that, in the deep Tropics, 150 mb typically lies in the upper troposphere, a fact that might confuse any purely tropical interpretation of the AMSU-A cross section. In reality, the mere fact that the tropopause over Sandy lay at 200 mb at 12Z on October 29 speaks volumes about the transitioning character of the storm (not to mention the developing baroclinic circulation I talked about earlier on this page). Eventually, Sandy's warm core at lower altitudes weakened and dissipated as the transition to a post-tropical storm was complete.
You might argue that I'm talking about nuances here, but, in my opinion, Sandy was not a hurricane (not purely tropical) at the time of landfall. Rather, it was in the process of transitioning to a post-tropical low-pressure system. Yes, to be fair, Sandy was not completely post-tropical either. Needless to say, the true nature of Sandy at the time of landfall will be debated in the scientific community. One thing's for certain...it was one of the most atypical storms that I can remember in my 35+ years as a forecaster.