
Migration/Relocation
Some aspects of climate change in the future are so challenging that the only real option is for people to migrate or relocate. One recent study concluded that there will be as many as 200 million climate-related migrants on the move in search of livable conditions by 2050. There are several different climate-related changes that may trigger migrations and relocations, but the main reasons have to do with rising sea level and reduction in surface water availability for agriculture and basic living.
Sea Level Related Migration/Relocation
Inhabitants of low-lying islands such as the Maldives (whose highest point is just 2.3 m above sea level), or low-lying coastal areas such as Bangladesh, are very clearly in for trouble as the sea rises. These areas are part of what has been called the Low Elevation Coastal Zone (LECZ) that lies within 10 meters of present sea level. Overall, this zone covers 2% of the world’s land area but contains 10% of the world’s population and 13% of the world’s urban population. Many of the countries with a large share of their population in this zone are small island countries, but most of the countries with large populations in the zone are large countries with heavily populated delta regions. Almost 65% of cities with populations greater than 5 million fall, at least partly, in the LECZ. In some countries (most notably China), urbanization is driving a movement in population towards the coast. Many of these places do not have the resources to keep building higher and higher sea walls to keep the water out, and even if they did, it might still be a losing battle. So, they will have to move to somewhere else.
Alaskan coastal and river communities are experiencing greater erosion and flooding because of increased storm activity and windiness; reduced sea-ice extent, which increases the intensity of storm surges; and thawing of permafrost, which increases susceptibility to erosion. Traditionally, many of these communities were semi-nomadic, moving inland during periods of severe storms, and had little permanent infrastructure. During the past 100 years, however, their mobility has been reduced by the building of houses, schools, airports, and other permanent facilities—changes that have increased their vulnerability to climate change. Six Alaskan communities are now planning some type of relocation. However, no funds have been appropriated to begin the relocation process. The U.S. Army Corps of Engineers has identified 160 additional villages in rural Alaska that are threatened by climate-related erosion, with relocation costs estimated at $30-50 million per village.
If we take a global inventory of the areas within the LECZ, we see a number of important features:
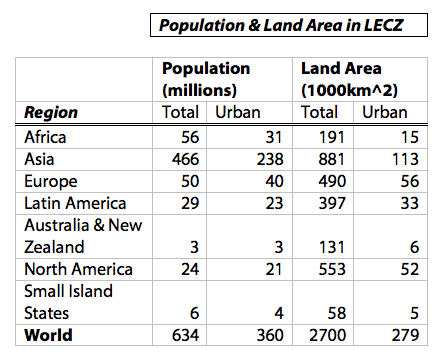
| - | Population (millions) | Population (millions) | Land Area (1000km^2) | Land Area (1000 km^2) |
|---|---|---|---|---|
| Region | Total | Urban | Total | Urban |
| Africa | 56 | 31 | 191 | 15 |
| Asia | 466 | 238 | 881 | 113 |
| Europe | 50 | 40 | 490 | 56 |
| Latin America | 29 | 23 | 397 | 33 |
| Australia and New Zealand | 3 | 3 | 131 | 6 |
| North America | 24 | 21 | 553 | 52 |
| Small Island States | 6 | 4 | 58 | 5 |
| Wordl | 634 | 360 | 2700 | 279 |
In most of the regions of the world, the majority of the population in the LECZ reside in cities; Asia is the big exception to this. The fact that most of these at-risk people live in cities raises problems for relocation since cities are based on an extensive infrastructure that is not easy to recreate in another place, while more rural populations are probably easier to relocate. Asia, in addition to having the greatest overall population, also has by far the greatest number of people who will have to deal with moving to higher elevations as the sea level rises.
On an individual basis, some countries are much worse off than others, as can be seen in this ranking of countries based on the total population that lives in the LECZ:
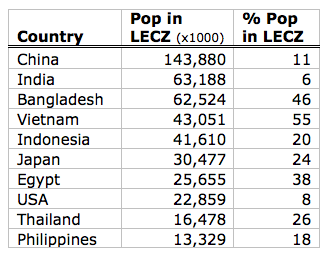
| Country | Pop in LECZ (x1000) | % Pop in LECZ |
|---|---|---|
| China | 143,880 | 11 |
| India | 63,188 | 6 |
| Bangladesh | 62,524 | 46 |
| Vietnam | 43,051 | 55 |
| Indonesia | 41,610 | 20 |
| Japan | 30,477 | 24 |
| Egypt | 25,655 | 38 |
| USA | 22,859 | 8 |
| Thailand | 16,478 | 26 |
| Philippines | 13,329 | 18 |
Asian countries occupy 8 of the top 10 here, so this will be the region of greatest concern when it comes to relocation problems related to sea-level rise.
If you look at the ranking in terms of the percentage of the population at risk from sea-level rise, you see the following:
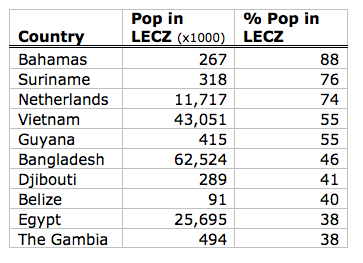
| Country | Pop in LECZ (x1000) | % Pop in LECZ |
|---|---|---|
| Bahamas | 267 | 88 |
| Suriname | 318 | 76 |
| Netherlands | 11,717 | 74 |
| Vietnam | 43,051 | 55 |
| Guyana | 415 | 55 |
| Bangladesh | 62,524 | 46 |
| Djibouti | 289 | 41 |
| Belize | 91 | 40 |
| Egypt | 25,695 | 38 |
| The Gambia | 494 | 38 |
This list excludes countries with a total population less than 100,000, or smaller than 1,000 km2. If all countries were included, 7 of the top 10 would be places with populations of less than 100,000, the top 5 having more than 90% of their country in the LECZ (Maldives, Marshall Islands, Tuvalu, Cayman Islands, Turk and Caicos Island).
Surface Water Related Migration/Relocation
In many parts of the world, especially rural areas, the local economy is based on agriculture that is made possible through irrigation, and most of that irrigation water comes from the diversion of rivers. As the climate changes, many areas will see a decline in the surface water needed for agriculture, and so these local economies will struggle. The global pattern of change can be seen in this figure, which is an average from many different climate models for the 20 year period centered on 2080:
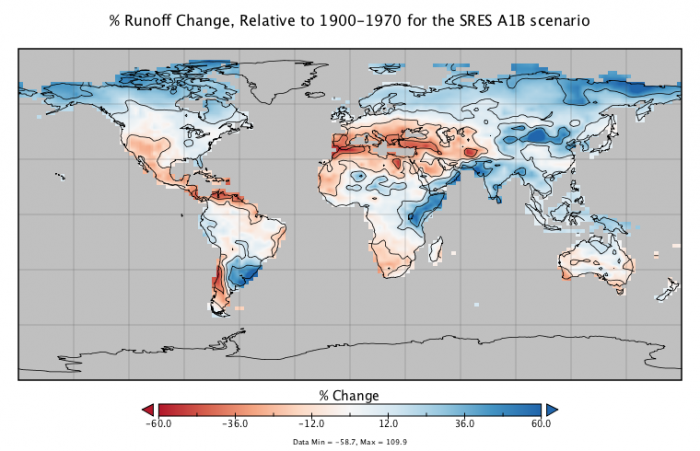
People will lose jobs — not just farmers, but also the many people whose work is somehow connected to agriculture — and these people will have to seek work elsewhere. Most of these people will move to cities, accelerating a general trend over the past few decades. Many of these migrations or relocations may not be dramatic or traumatic, but in some cases, they will cause real hardship. The vast majority of the people who will be required to move are lower-income people who do not have the means nor the political capital to make these transitions easily.
The above global map does not tell the whole story though, since the timing of water availability is important. In the whole region of Asia surrounding the Himalayan mountains, the rivers that drain from mountain glaciers are an essential part of agricultural economies. The glaciers melt back in the summer and provide important streamflow during a period of the growing season when rainfall is low. These glaciers are melting rapidly, and once they disappear, the dry-season glacial meltwater will not be there to supply the irrigation water. As a result, agricultural production and the work related to it will also dry up. In Pakistan, for example, 90% of the agriculture is based on irrigated water diverted from the Indus River, which is fed by Himalayan glaciers.
The global map above highlights an important reduction in surface water in the region of Central America. This is likely to increase the existing pressure for migration to the US.