
Global GHG emissions from energy use and production far outweigh emissions from other activities. The industrial processes, agriculture, land-use change and forestry, and waste management sectors together account for 37 percent of all global GHG emissions in the accompanying pie chart. However, a significant proportion of the emissions from agriculture and from land-use change and forestry involve fossil fuel consumption, so the percentage of emissions from energy is greater than the graphic implies. Consequently, far more than two thirds of all GHG emissions result from energy use and production.
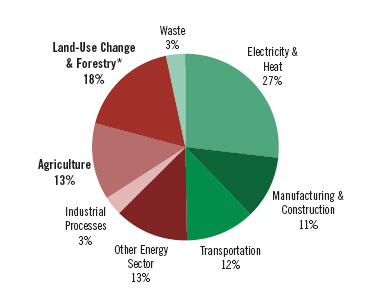
This is a pie chart showing the percent of GHG emission from various activities. Below it is represented as a table.
| Source of GHG Emission | Percent of total |
|---|---|
| Electricity and Heat | 27% |
| Manufacturing and Construction | 11% |
| Transportation | 12% |
| Other Energy Sector | 13% |
| Industrial Processes | 3% |
| Agriculture | 13% |
| Land-Use Change and Forestry | 18% |
| Waste | 3% |
In the pie chart, electricity and heat production is clearly the largest emitter of GHGs, being responsible for over one quarter of total emissions. Most of these emissions are attributable to society’s dependence on coal and secondarily on natural gas. The remaining energy categories –– manufacturing and construction, transportation, and “other” –– each contribute approximately equal proportions of the global GHG emissions.
Going beyond this particular graphic, when compiling the national GHG emissions inventory, the US breaks its energy sector emissions into three broad categories: mobile sources, stationary sources, and fugitive sources.
The stationary sources category is large and includes many activities.
- Most prominent in terms of GHG emissions is the electricity and heat generation subsector, mentioned above.
- Most of these emissions come from coal-fired power plants that generate electricity, heat, or both (through co-generation). Increasingly, because supplies are becoming cheaper and more plentiful, natural gas is replacing some of the generation capacity provided by coal, thereby reducing GHG emissions when there is a direct substitution of natural gas for coal.
- Power generation from natural gas emits about one half the emissions of coal, but is nevertheless still a potent source of GHGs.
- Moreover, developing countries such as China and India are building huge numbers of coal-fired power plants and –– although the newer ones use more advanced technologies that emit about one third fewer GHGs than old technologies –– are adding vast quantities of GHGs to the atmosphere.
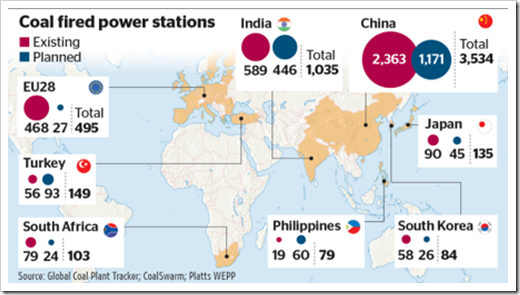
| Country | Existing | Planned | Total |
|---|---|---|---|
| EU28 | 468 | 27 | 495 |
| Turkey | 56 | 93 | 149 |
| South Africa | 79 | 24 | 103 |
| Philippines | 19 | 60 | 79 |
| South Korea | 58 | 26 | 84 |
| Japan | 90 | 45 | 135 |
| India | 589 | 446 | 1035 |
| China | 2363 | 1171 | 3534 |
There are many other important categories of GHG-producing activities:
- manufacturing and construction together are the second-largest emitters among the stationary sources behind electricity generation;
- mining (excluding coal mining) and the fossil fuel industries (including coal mining, petroleum and natural gas extraction, and fuel processing) are also major emitters;
- as noted earlier, agriculture and forestry consume fossil fuels;
- stationary sources involve food-processing and forest product-processing facilities, for instance;
- compared to the other stationary sources, commercial (e.g., corporate buildings, small businesses), institutional (e.g., government buildings, universities, prisons), and residential energy sources produce relatively modest quantities of GHGs through direct consumption of fossil fuels.
Even so, these enterprises consume huge amounts of electricity, and most of this electricity comes from fossil fuel-powered power plants, so these categories are indirectly responsible for a very large proportion of GHG emissions.
In addition to transportation and stationary sources, fugitive CH4 emissions from coalmines and from oil and natural gas drilling sites, as well as from natural gas pipelines, were thought to be a relatively small source of GHG emissions. Recent work, however, suggests that fugitive emissions may in fact be a major source of atmospheric CH4, so this part of the energy sector is coming under increased, intense scrutiny.
- Explained: Fugitive methane emissions from natural gas production (Carbon Brief, 2014) gives a nice overview of some of the more recent studies that have tried to answer this question.
- A close look at fugitive methane emissions from natural gas (Bradbury and Obeiter, 2013) also gives a nice brief summary of the context of the problem and ways of trying to quantify its severity.
The relationships among energy production, energy storage and distribution, energy marketing, and energy demand and consumption are extremely complex. Thus, trying to pin GHG emissions to any one component in this complex web is arbitrary. Indeed, calculating emissions from the energy sector is fraught with error because of this complexity. It is best to think not in terms of exact proportions of GHG emissions from any one activity or subsector, but in terms of which categories are the big players.