
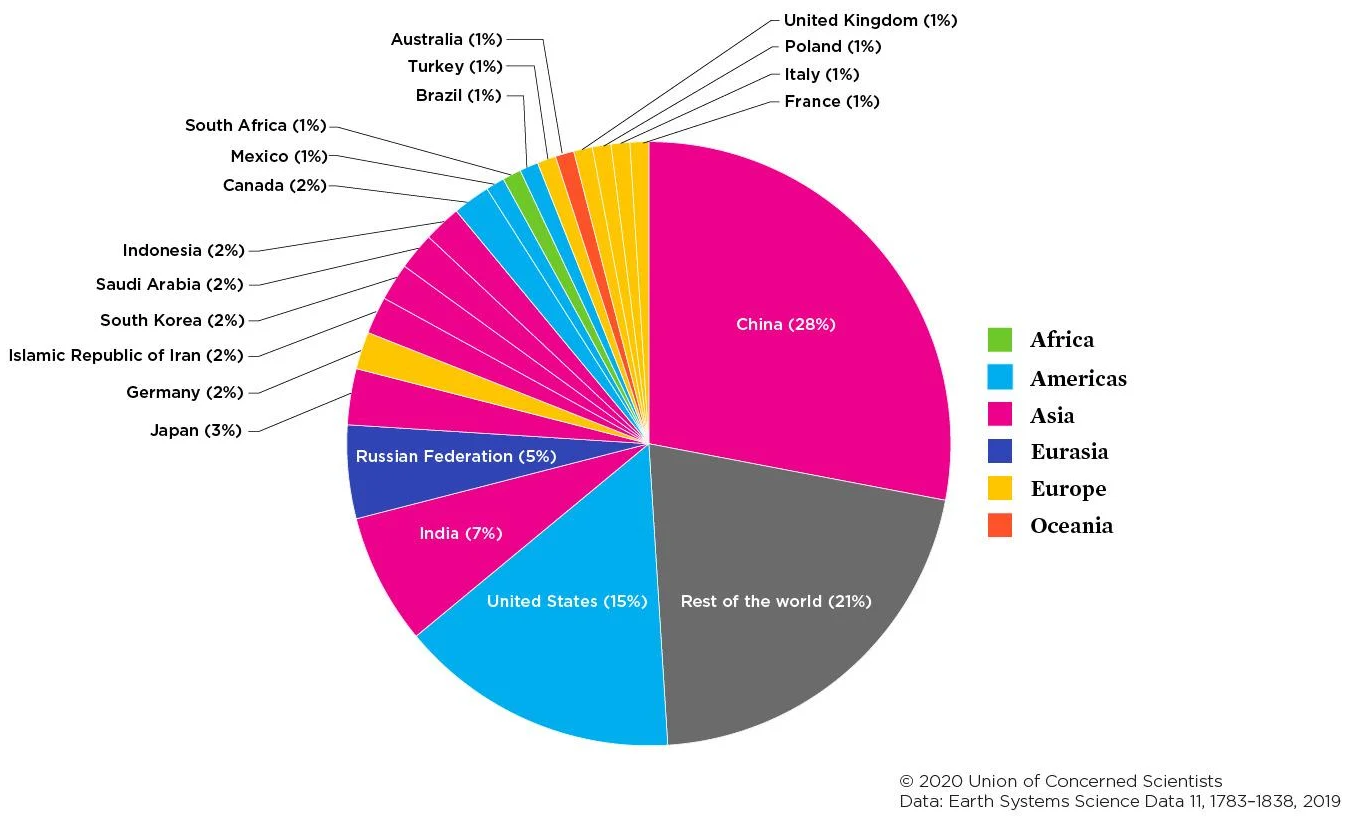
The next image shows CO2 emissions from fossil fuel combustion by country. In 2015, China's share was 28 percent of the world’s CO2, while the US share was 15 percent. The next closest country, India, emitted about 6 percent of the CO2. Clearly, to bring down global emissions from the energy sector, China and the US must lead the way.
| Country | Percentage |
|---|---|
| China | 28% |
| USA | 15% |
| India | 7% |
| Russian Federation | 5% |
| Japan | 3% |
| Germany | 2% |
| South Korea | 2% |
| Iran | 2% |
| Canada | 2% |
| Saudi Arabia | 2% |
| Rest of the World | 30% |
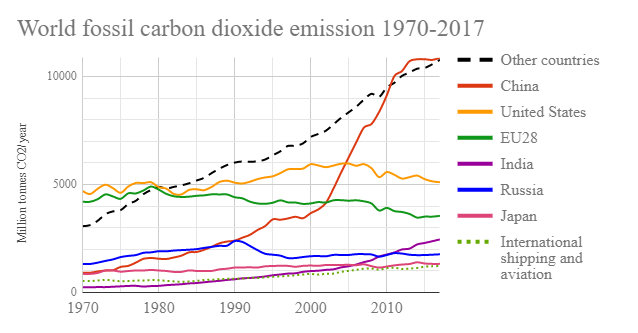
The next image is a graph depicting fossil fuel-based CO2 emissions for the US, China, several other key emitters, and the aggregate rest of the world between 1970-2017. What jumps out at you?
- China’s emissions rose sharply after the turn of the century, while the U.S. emissions started to flatten out and drop at the end of that same period. These trends have continued. It is important to note that estimates (Liu et al., 2013. Block, n.d.) attribute one-third of China’s emissions to their exports and 20 percent of those exports come to the U.S. Thus, this fact implies that U.S. CO2 emissions should be higher and China’s emissions lower. In any case, both nations dominate global carbon dioxide emissions.
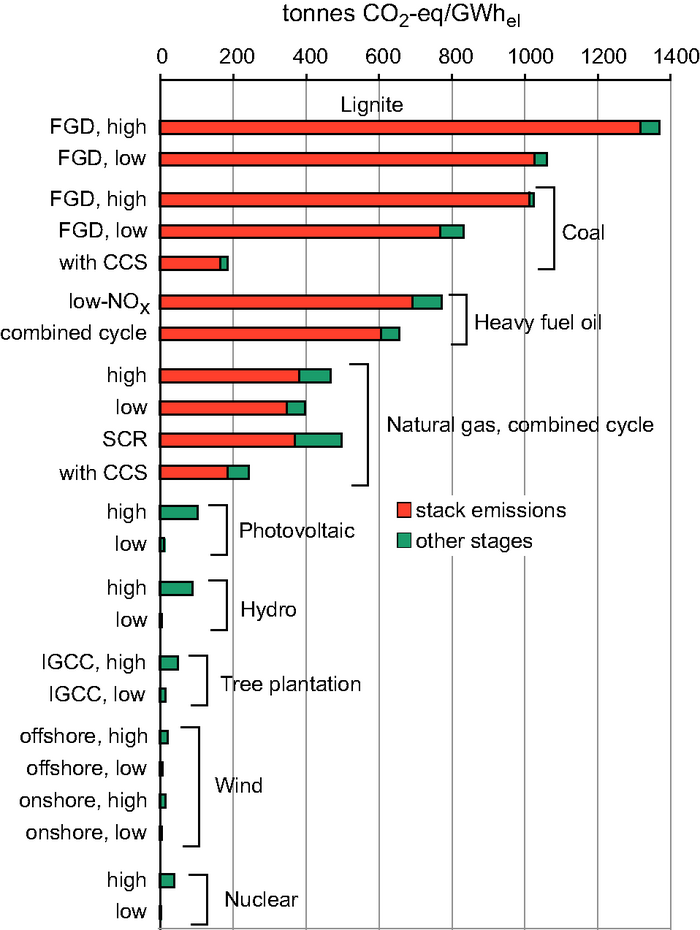
The next image displays the GHG emissions from the various systems used to generate electricity. Clearly, coal and its close cousin lignite produce the most GHG per unit of energy produced. Fuel oil is the next most GHG-intensive generation system. Natural gas, which is often touted as the clean alternative to coal, certainly emits about half as many GHGs per unit of energy but is still extremely GHG-intensive compared to non-fossil fuel alternatives. Renewables and nuclear produce trivial quantities of GHGs compared to the three fossil fuel types –– coal, oil, and natural gas.
| Electricity Generation System | Stack Emissions (tonnes CO2-eq/GWhel) |
Other stages |
|---|---|---|
| Lignite (FGD, high) | 1300 | 1300-1350 |
| Lignite (FGD, low) | 1025 | 1025-1050 |
| Coal (FGD, high) | 1020 | 1020-1025 |
| Coal (FGD, low) | 750 | 750-825 |
| Coal (with CCS) | 150 | 150-175 |
| Heavy fuel oil (low-NOx) | 700 | 700-775 |
| Heavy fuel oil (combined cycle) | 600 | 600-650 |
| Natural Gas, combined cycle (high) | 375 | 375-500 |
| Natural Gas, combined cycle (low) | 350 | 350-400 |
| Natural Gas, combined cycle (SCR) | 375 | 375-500 |
| Natural Gas, combined cycle (with CCS) | 175 | 175-250 |
| Photovoltaic (high) | - | 125 |
| Photovoltaic (low) | - | 25 |
| Hydro (high) | - | 100 |
| Hydro (low) | - | 5 |
| Tree plantation (IGCC, high) | - | 50 |
| Tree plantation (IGCC, low) | - | 20 |
| Wind (offshore, high) | - | 25 |
| Wind (offshore, low) | - | 5 |
| Wind (onshore, high) | - | 20 |
| Wind (onshore, low) | - | 5 |
| Nuclear (high) | - | 50 |
| Nuclear (low) | - | 0 |
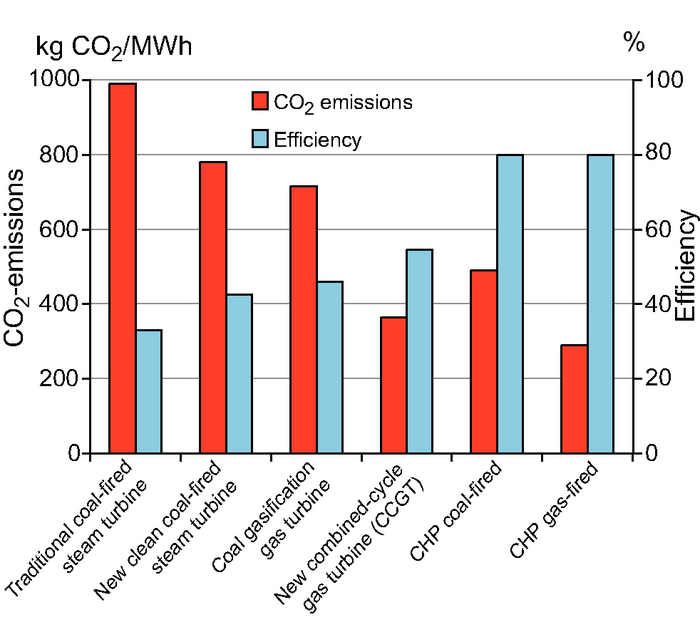
The final graphic in this section illustrates the fact that CO2 emissions go down as efficiency in burning fossil fuel in power generation goes up. For coal, new technologies improve efficiencies and reduce emissions –– but they are still exceptionally high compared to the alternatives. New natural gas power generation is about half as CO2-intensive as the best single-purpose coal-fired power plant. Cogeneration (also known as CHP, combined heat and power) is dual-purpose and drastically improves the efficiency of any fossil fuel power generating system, halving the efficiency of single-purpose systems.
| Energy Generation System | CO2 Emissions (kg CO2/MWh | Efficiency (Percentage) |
|---|---|---|
| Traditional coal-fired steam turbine | 995 | 30 |
| New clean coal-fired steam turbine | 775 | 40 |
| Coal gasification gas turbine | 700 | 45 |
| New combined-cycle gas turbine (CCGT) | 375 | 55 |
| CGP coal-fired | 500 | 80 |
| CHP gas-fired | 275 | 80 |