
All Together
Here are the terrestrial flow processes once again, but this time with the estimated magnitudes of flows included. Most of these are very large flows, and they have a seasonality to them — photosynthesis is obviously big in the growing season, but it is small in the winter. If land masses and land plants were equally divided in the northern and southern hemispheres, this seasonality would cancel out, but in today's world, a large majority of land and plants are in the Northern Hemisphere, so around July, photosynthesis is very strong. In fact, this on and off aspect of photosynthesis is the primary reason for the seasonal changes in atmospheric CO2 concentrations seen in the Mauna Loa record.
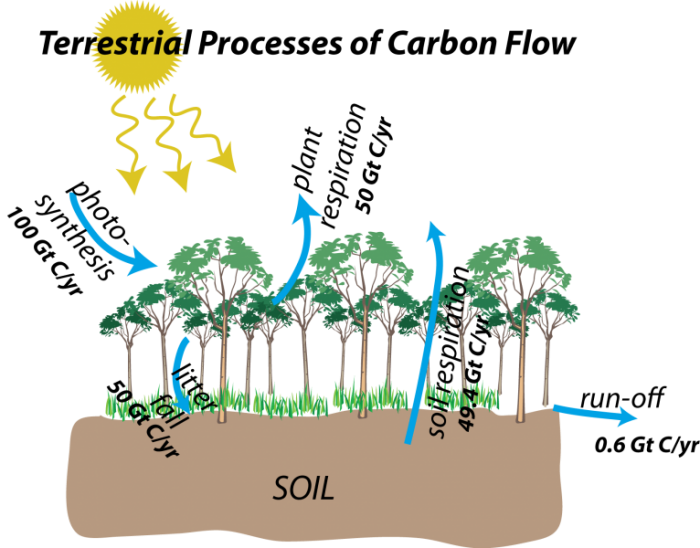
This image illustrates the terrestrial carbon cycle in a forest ecosystem. At the top left, there is a bright yellow sun with the word "estria" written on it, emitting three yellow, wavy arrows downward to represent sunlight. Below the sun, a row of green trees with brown trunks stands on a grassy surface, with a brown soil layer beneath. Blue arrows indicate the movement of carbon through various processes:
- A blue arrow curves from the sunlight down to the trees, representing carbon absorption through photosynthesis.
- Another blue arrow points upward from the trees into the air, labeled "49 GtC/yr," indicating carbon dioxide release through plant respiration.
- A blue arrow curves from the trees downward to the ground, labeled "litterfall," showing carbon transfer via fallen leaves and organic matter.
- A blue arrow rises from the soil into the air, labeled "49 GtC/yr," representing carbon dioxide release through soil respiration.
- A blue arrow extends horizontally from the soil to the right, indicating carbon loss through run-off.
The word "SOIL" is written in black within the brown soil layer. The background is solid black, emphasizing the elements of the carbon cycle.