
Distribution of Water on the Earth’s Surface
Introduction
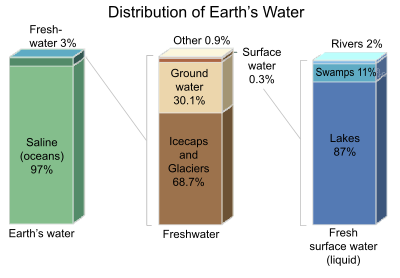
A diagram illustrating the distribution of Earth's water, focusing on the proportions of saline (ocean) water and freshwater sources. It features three rectangular blocks representing different water categories. The largest block on the left, labeled "Saline (ocean)," is green and occupies 97% of the total water. The middle block represents freshwater, divided into two sections: "Ground water" at 30.1% (light brown) and "Icecaps and Glaciers" at 68.7% (dark brown). The smallest block on the right, in blue, represents surface freshwater, with "Lakes" at 87% and "Swamps" at 11% of this portion.
- Saline Water Block (Left)
- Label: Saline (ocean)
- Proportion: 97%
- Color: Green
- Position: Leftmost block
- Freshwater Block (Middle)
- Sections:
- Ground Water
- Proportion: 30.1%
- Color: Light brown
- Position: Top section
- Icecaps and Glaciers -লProportion: 68.7%
- Color: Dark brown
- Position: Bottom section
- Ground Water
- Position: Center block
- Sections:
- Surface Freshwater Block (Right)
- Sections:
- Lakes
- Proportion: 87%
- Color: Blue
- Position: Bottom section
- Swamps
- Proportion: 11%
- Color: Light blue
- Position: Top section
- Lakes
- Position: Rightmost block
- Sections:
- Visual Elements
- Blocks: Three rectangular blocks of varying sizes
- Proportions: Percentages labeled within each section
- Color Coding: Green for saline, brown for groundwater and icecaps, blue for lakes and swamps
The distribution of water on the Earth’s surface is extremely uneven. Only 3% of water on the surface is fresh; the remaining 97% resides in the ocean. Of freshwater, 69% resides in glaciers, 30% underground, and less than 1% is located in lakes, rivers, and swamps. Looked at another way, only one percent of the water on the Earth’s surface is usable by humans, and 99% of the usable quantity is situated underground.
All one needs to do is study rainfall maps to appreciate how uneven the distribution of water really is. The white areas on the map below had annual rainfall under 400 mm for the last year, which makes them semi-arid or arid. And, remember, projections are for significant aridification to occur in many dry regions and for more severe rainfall events to characterize wet regions.
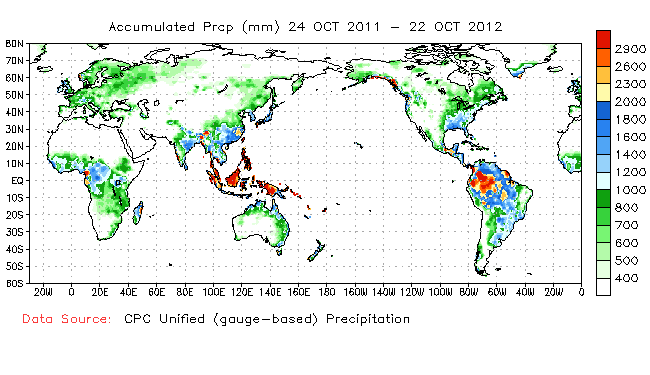
A world map showing accumulated precipitation in millimeters from October 24, 2011, to October 22, 2012, sourced from the CPC Unified (gauge-based) Precipitation dataset. The map uses a color gradient to represent precipitation levels, ranging from 400 mm (light green) to 2900 mm (dark red). High precipitation areas (red and orange) are concentrated in parts of South America, Southeast Asia, and the western Pacific, with values exceeding 2000 mm. Moderate precipitation (green to yellow) is widespread across North America, Africa, and Australia, ranging from 400 to 1400 mm. Low precipitation areas (light green) are seen in northern regions like Canada and Russia.
- Precipitation Scale
- Range: 400 mm to 2900 mm
- Color Gradient:
- 400 mm: Light green
- 800-1400 mm: Green to yellow
- 1800-2300 mm: Orange
- 2600-2900 mm: Dark red
- Position: Right side of the map
- High Precipitation Areas
- Regions: South America (e.g., Amazon Basin), Southeast Asia, Western Pacific
- Values: Exceeding 2000 mm (orange to dark red)
- Color: Orange to dark red
- Moderate Precipitation Areas
- Regions: North America, Africa, Australia
- Values: 400 to 1400 mm
- Color: Green to yellow
- Low Precipitation Areas
- Regions: Northern Canada, Russia, parts of Antarctica
- Values: Around 400 mm
- Color: Light green
- Geographic Features
- Continents: North America, South America, Africa, Europe, Asia, Australia, Antarctica
- Latitude: 80N to 60S
- Longitude: 180W to 180E