Click here to see a text description.
Station Visibility Diagram
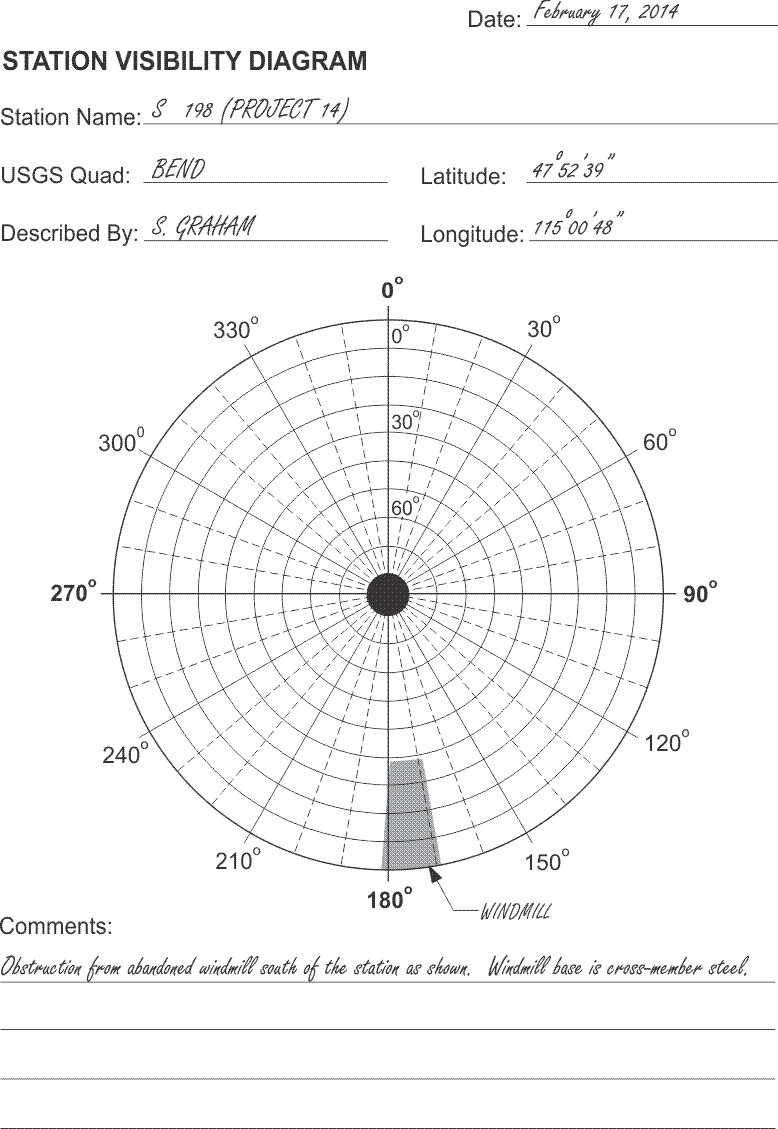
Date: February 17, 2014
Station Name: S 198 (PROJECT 14)
Described By: S. GRAHAM
USGS Quad: BEND
Latitude: 47 degrees 52'39"
Longitude: 115 degrees 00'48"
radial diagram showing where the windmill is located
Comments: Obstruction from abandoned windmill south of the station as shown. Windmill base is cross-member steel.
Obstructions above the mask angle of a GPS/GNSS receiver must be taken into account in finalizing the observation schedule. A station that is blocked to some degree is not necessarily unusable, but its inclusion in any particular session is probably contingent on the position of the specific satellites involved.
It is important for GPS/GNSS observations to have a good view of the sky. Obstructions above the mask angle must be taken into account, especially with static control survey.
An Example
The diagram in the illustration is widely used to record such obstructions during reconnaissance. It is known as a station visibility diagram, a polar plot, or a skyplot. The concentric circles are meant to indicate 10° increments along the upper half of the celestial sphere, from the observer’s horizon at 0° on the perimeter, to the observer’s zenith at 90° in the center. The hemisphere is cut by the observer’s meridian, shown as a line from 0° in the north to 180° in the south. The prime vertical is signified as the line from 90° in the east to 270° in the west. The other numbers and solid lines radiating from the center, every 30° around the perimeter of the figure, are azimuths from north and are augmented by dashed lines every 10°.
Drawing obstructions
Using a compass and a clinometer, a member of the reconnaissance team can fully describe possible obstructions of the satellite’s signals on a visibility diagram. By standing at the station mark and measuring the azimuth and vertical angle of points outlining the obstruction, the observer can plot the object on the visibility diagram. For example, a windmill base is shown on in the illustration as a cross-hatched figure. It has been drawn from the observer's horizon up to 37° in vertical angle, from 168° to about 182° in azimuth at its widest point. This description by approximate angular values is entirely adequate for determining when particular satellites may be blocked at this station.
Once completed, this diagram allows you to correlate the obstructions shown with other charts that give you the number of satellites available, the azimuth and height of those satellites at a particular time. With all this information, you will be able to design the observation session on this particular point so that satellites will not be obstructed.
| Time | SV 3 Elev. |
SV 3 Azim. |
SV 12 Elev. |
SV 12 Azim. |
SV 13 Elev. |
SV 13 Azim. |
SV 20 Elev. |
SV 20 Azim. |
SV 24 Elev. |
SV 24 Azim. |
Elev. |
Azim. |
PDOP |
|---|---|---|---|---|---|---|---|---|---|---|---|---|---|
| 8:50 | 54 | 235 | 74 | 274 | 44 | 28 | 16 | 308 | 68 | 169 | 4.8 | ||
| 9:00 | 51 | 229 | 74 | 255 | 40 | 32 | 20 | 310 | 72 | 163 | 5.7 | ||
| 9:10 | 47 | 224 | 72 | 238 | 37 | 35 | 23 | 311 | 77 | 153 | 4.9 | ||
| 9:20 | 43 | 219 | 68 | 226 | 33 | 38 | 27 | 313 | 80 | 134 | 1.0 |
| Time | SV 3 Elev. |
SV 3 Azim. |
SV 12 Elev. |
SV 12 Azim. |
SV& 13 Elev. |
SV 13 Azim. |
SV 16 Elev. |
SV 16 Azim. |
SV 20 Elev. |
SV 20 Azim. |
SV 24 Elev. |
SV 24 Azim. |
PDOP |
|---|---|---|---|---|---|---|---|---|---|---|---|---|---|
| 9:30 | 39 | 215 | 64 | 218 | 29 | 41 | 16 | 179 | 31 | 314 | 81 | 102 | 2.1 |
| 9:40 | 35 | 212 | 59 | 213 | 26 | 45 | 19 | 176 | 36 | 314 | 80 | 73 | 2.3 |
| 9:50 | 31 | 209 | 54 | 209 | 23 | 48 | 23 | 173 | 40 | 315 | 76 | 57 | 2.4 |
| 10:00 | 27 | 207 | 49 | 206 | 19 | 52 | 27 | 170 | 44 | 314 | 72 | 49 | 2.5 |
| 10:10 | 23 | 204 | 44 | 204 | 16 | 55 | 30 | 167 | 48 | 314 | 67 | 45 | 2.5 |
For example, suppose a 1-hour session from 9:10 to 10:10, illustrated in this table, was under consideration for the observation on station S 198. The station visibility chart might motivate a careful look at space vehicle (SV) pseudorandom noise (PRN) 16. Twenty minutes into the anticipated session, at 9:30 SV 16 has just risen above the 15° mask angle. Under normal circumstances, it would be available at station S 198, but it appears from the polar plot that the windmill will block its signals from reaching the receiver. In fact, the signals from SV 16 will apparently not reach station S 198 until sometime after the end of the session at 10:10.
Working around Obstructions
Under the circumstances, some consideration might be given to observing station S 198 during a session when none of the satellites would be blocked. However, the 9:10 to 10:10 session may be adequate after all. Even if SV 16 is completely blocked, the remaining 5 satellites will be unobstructed, and the constellation still will have a relatively low position dilution of precision (PDOP). Still, the analysis must be carried to other stations that will be occupied during the same session. The success of the measurement of any baseline depends on common observations at both ends of the line. Therefore, if the signals from SV 16 are garbled or blocked from station S 198, any information collected during the same session from that satellite at the other end of a line that includes S 198 will be useless in processing the vector between those two stations.
However, the material of the base of the abandoned windmill has been described on the visibility diagram as cross-membered steel, so it is possible that the signal from SV 16 will not be entirely obstructed during the whole session. There may actually be more concern of multipath interference from the structure than that of signal availability. One strategy for handling the situation might be to program the receiver at S 198 to ignore the signal from SV 16 completely if the particular receiver allows it. The visibility diagram and the azimuth-elevation table complement each other. They provide the field supervisor with the data needed to make informed judgments about the observation schedule. Even if the decision is taken to include station S 198 in the 9:10 to 10:10 session as originally planned, the supervisor will be forewarned that the blockage of SV 16 may introduce a bit of weakness at that particular station.